Fig. 5.
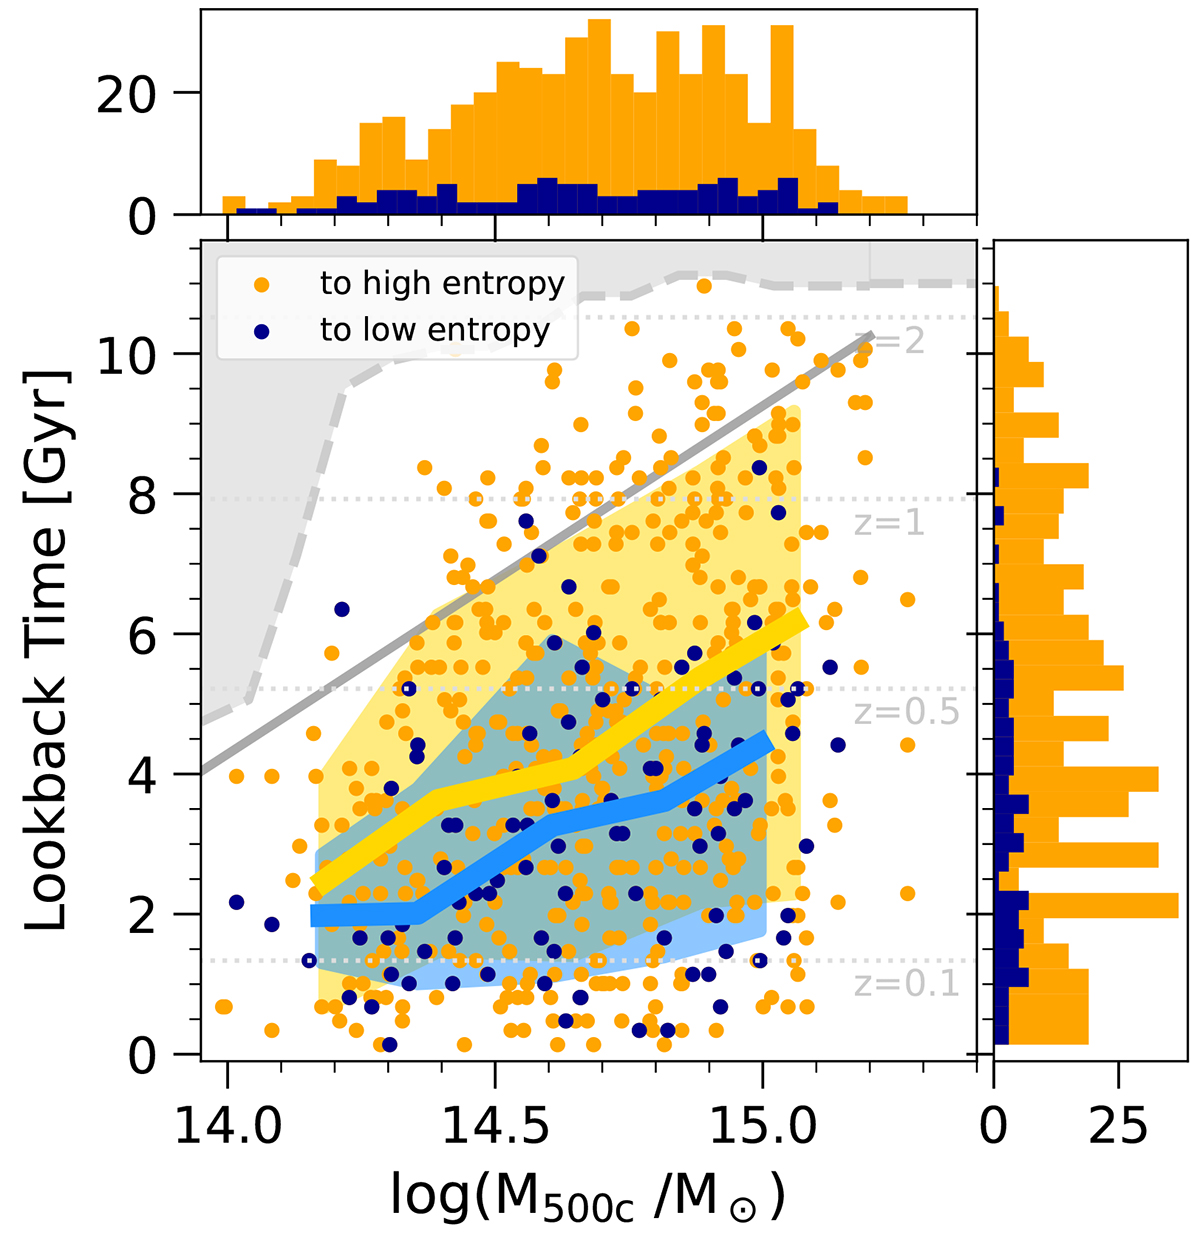
Download original image
Correlation between the lookback time of a transformation and cluster mass at z = 0 according to TNG-Cluster. Transformations to higher core entropy are shown in orange, while transformations to lower core entropy are shown in dark blue. Marginalized histograms of each axis quantity are shown with the top and right subpanels, respectively. The dashed gray line indicates the earliest formation times for our halos, i.e., the earliest possible transformation times. The solid gray line depicts the average formation times (i.e., the fit to the results presented in Fig. 2). The gold (light blue) lines and bands show the median and 16 to 84 percentile ranges for changes to higher (lower) core entropy. The average lookback time of transformations increases with halo mass, in part because more massive clusters form earlier and may therefore experience more and earlier transformations. Changes to higher core entropy happen at all times, while changes to lower core entropy occur only at later times, potentially reflecting different physical drivers.
Current usage metrics show cumulative count of Article Views (full-text article views including HTML views, PDF and ePub downloads, according to the available data) and Abstracts Views on Vision4Press platform.
Data correspond to usage on the plateform after 2015. The current usage metrics is available 48-96 hours after online publication and is updated daily on week days.
Initial download of the metrics may take a while.