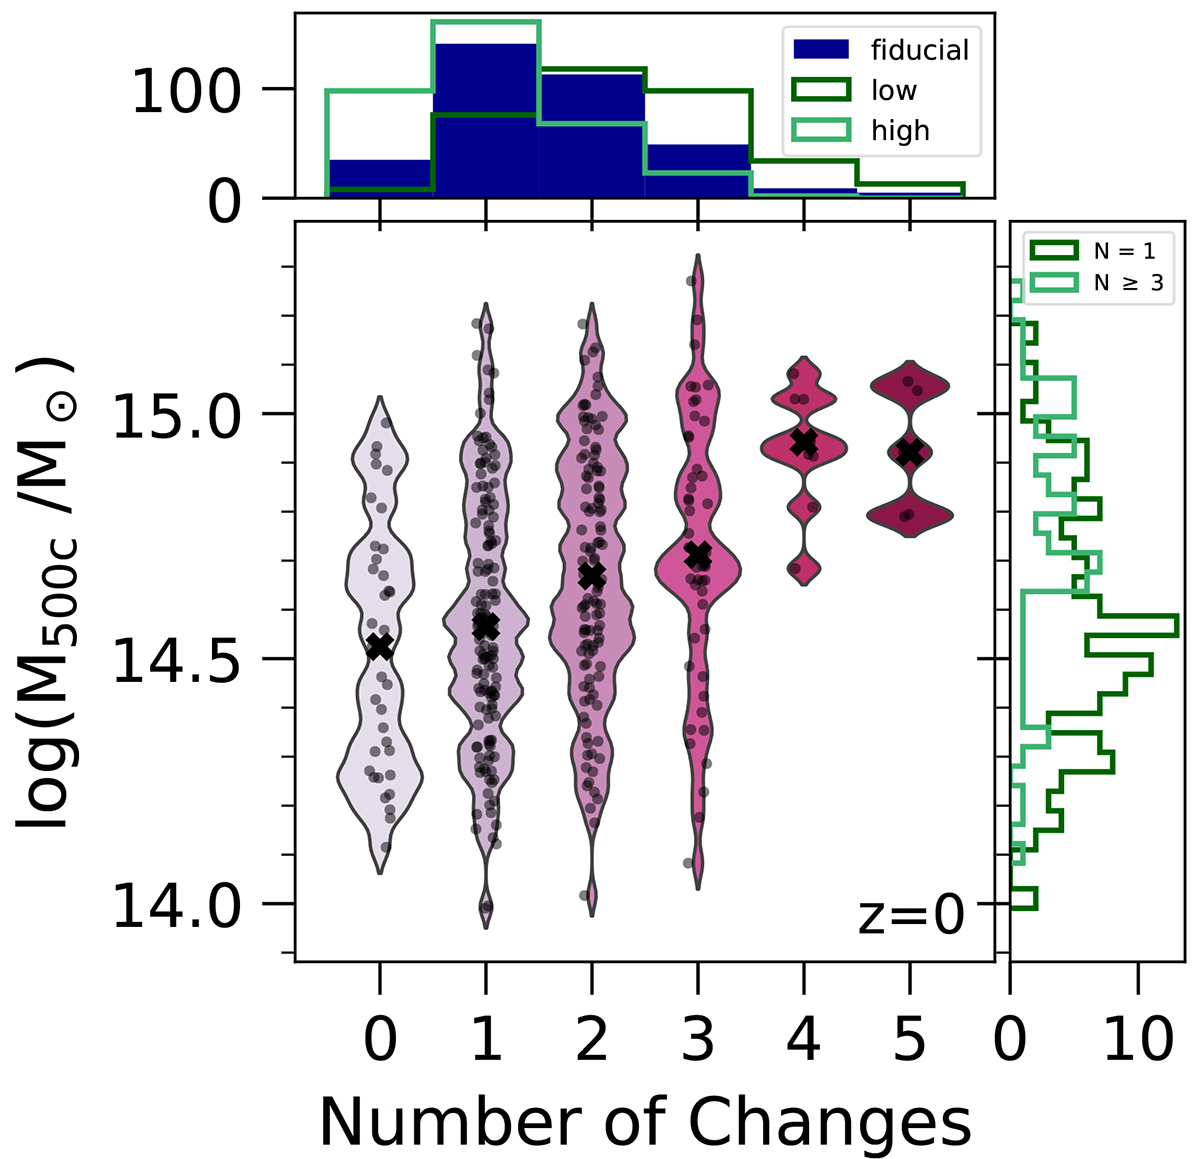
Fig. 6.
Download original image
Number of core transformations across the history of each TNG-Cluster halo, as a function of M500c at z = 0. In the main panel, black dots represent individual halos, while the equal-width violins depict the corresponding mass distributions. The black crosses show the median halo mass for each number of transformations. The subpanels show the distributions of number of transformations (top) and halo mass (right). In the top, we contrast our fiducial analysis choice (dark blue) with the impact of varying the threshold applied to the K0 time derivative (dark green and light green histograms). The histogram in the right panel shows the mass distribution for clusters that have only one (equal or more than three) transformation(s) in darker (lighter) green. In general, the majority of clusters undergo between one and three transformations over their lifetime. More massive clusters undergo more transformations, on average.
Current usage metrics show cumulative count of Article Views (full-text article views including HTML views, PDF and ePub downloads, according to the available data) and Abstracts Views on Vision4Press platform.
Data correspond to usage on the plateform after 2015. The current usage metrics is available 48-96 hours after online publication and is updated daily on week days.
Initial download of the metrics may take a while.