Fig. 7.
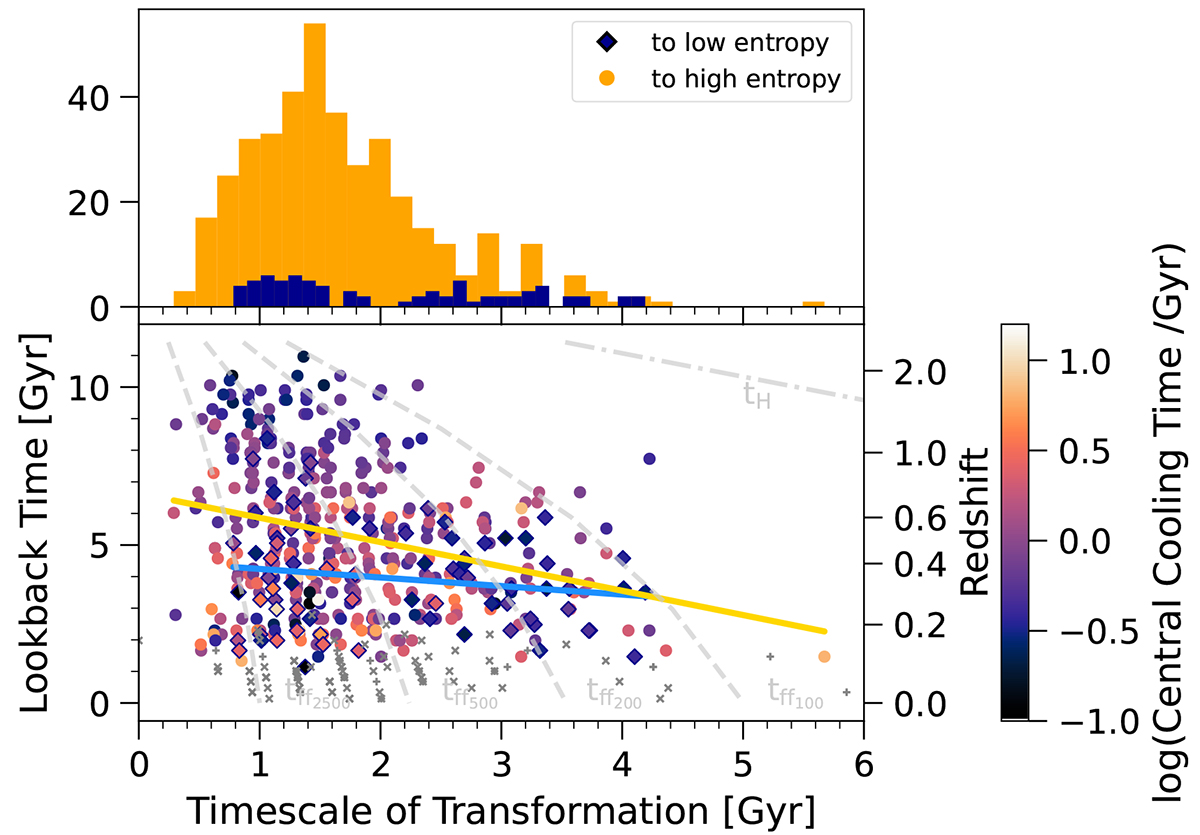
Download original image
Correlation of transformation timescale with the lookback time of the transformation (lower panel) and the marginalized distribution of these timescales (upper panel) across the total TNG-Cluster population. The timescale measures the duration of a transformation (for a detailed definition see Sect. 2.3). In the top panel, the yellow histogram shows transformations toward high entropy, while blue shows transformations to low entropy. In the main panel, circles show the former, and diamonds with blue outlines the latter, while all symbols are colored by central cooling time at the time of the transformation. Small gray crosses and pluses mark transformations near z = 0 for which we cannot measure a timescale (see text). The dash-dotted line indicates the age of the universe as a function of redshift, and the dashed lines show free-fall times at various radii. Transformations to higher core entropy are on average faster with a mean (standard deviation) of 1.7 Gyr (0.8 Gyr), versus changes to lower core entropy (mean: 2.0 Gyr, standard deviation: 1.0 Gyr). The distribution of transformation timescales toward low entropy appears double-peaked (see text).
Current usage metrics show cumulative count of Article Views (full-text article views including HTML views, PDF and ePub downloads, according to the available data) and Abstracts Views on Vision4Press platform.
Data correspond to usage on the plateform after 2015. The current usage metrics is available 48-96 hours after online publication and is updated daily on week days.
Initial download of the metrics may take a while.