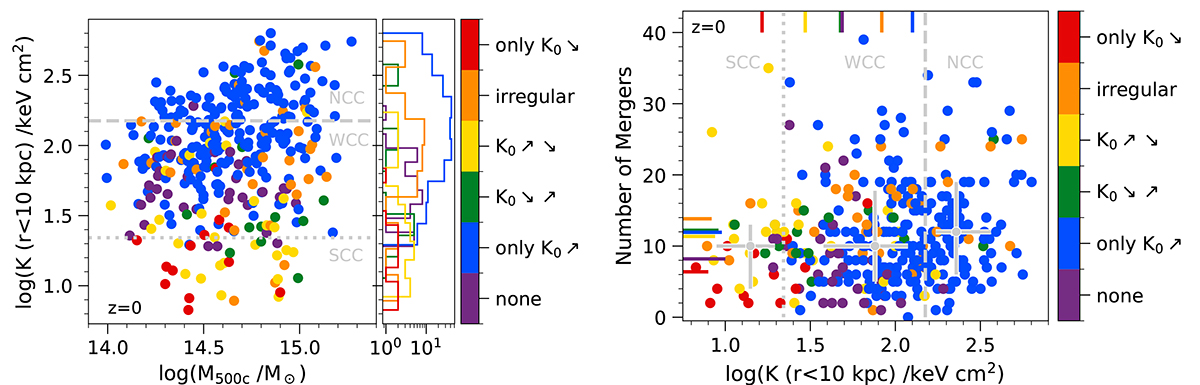
Fig. 9.
Download original image
Correlation of central entropy at z = 0 with the cluster mass at z = 0 (left panel) and numbers of mergers (right panel), for all halos in TNG-Cluster. Each cluster is colored by its archetype (see text and Table 1). The gray horizontal or vertical lines indicate the central entropy values used to classify (N)CCs and the gray markers in the right plot indicate the mean number of mergers and the 1σ range for SCCs, WCCs and NCCs. The subplot in the left plot shows the marginalized histograms of central entropy for each of the six categories. We find that clusters experiencing only changes to higher core entropy (blue) end up with higher core entropy at z = 0 and are found across the whole mass range. In contrast, clusters that only change toward lower core entropy (red) are preferably found among lower mass clusters. In addition, the average number of mergers for the latter case is smaller than for clusters with changes to high core entropy only, suggesting that mergers likely play a role in driving transformations.
Current usage metrics show cumulative count of Article Views (full-text article views including HTML views, PDF and ePub downloads, according to the available data) and Abstracts Views on Vision4Press platform.
Data correspond to usage on the plateform after 2015. The current usage metrics is available 48-96 hours after online publication and is updated daily on week days.
Initial download of the metrics may take a while.