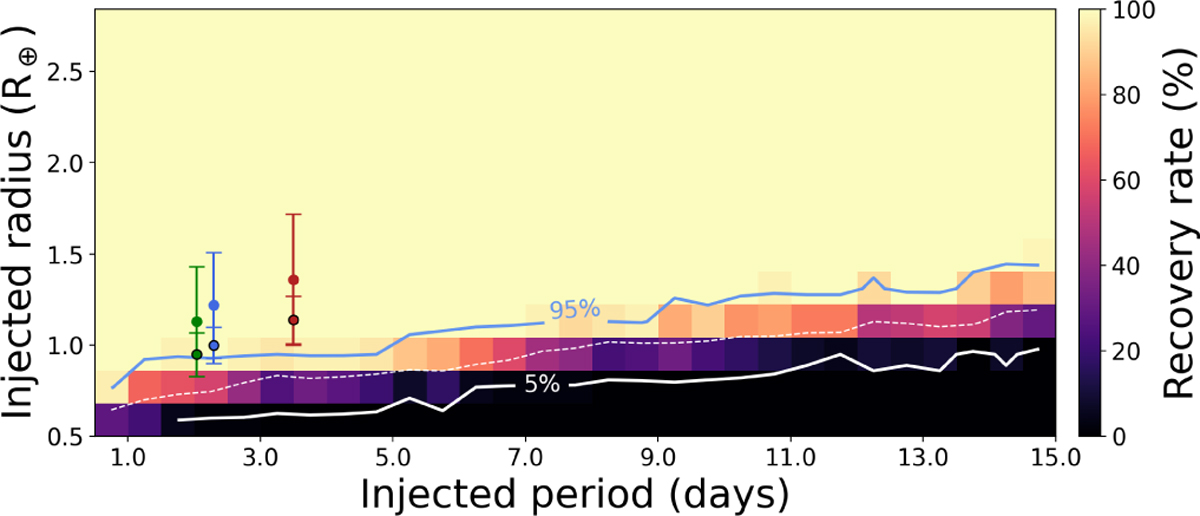
Fig. 12
Download original image
MATRIX injection-and-recovery experiment conducted to establish the detection limits using the ten TESS sectors described in Sect. 3.1. We explored a total of 18 000 different scenarios, where each pixel evaluated 40 of them. Colours indicate the recovery rate: bright yellow is for a high recovery, and dark purple and black are for a low recovery. The solid blue line indicates the 95% recovery contour, the dashed white line marks the 50% recovery contour, and the solid white line corresponds to the 5% recovery contour. Blue, red, and green points show planets b and c and candidate .02, respectively. Black-edged circles denote planets orbiting the primary star; edge-free circles indicate the secondary star.
Current usage metrics show cumulative count of Article Views (full-text article views including HTML views, PDF and ePub downloads, according to the available data) and Abstracts Views on Vision4Press platform.
Data correspond to usage on the plateform after 2015. The current usage metrics is available 48-96 hours after online publication and is updated daily on week days.
Initial download of the metrics may take a while.