Fig. F.1
Download original image
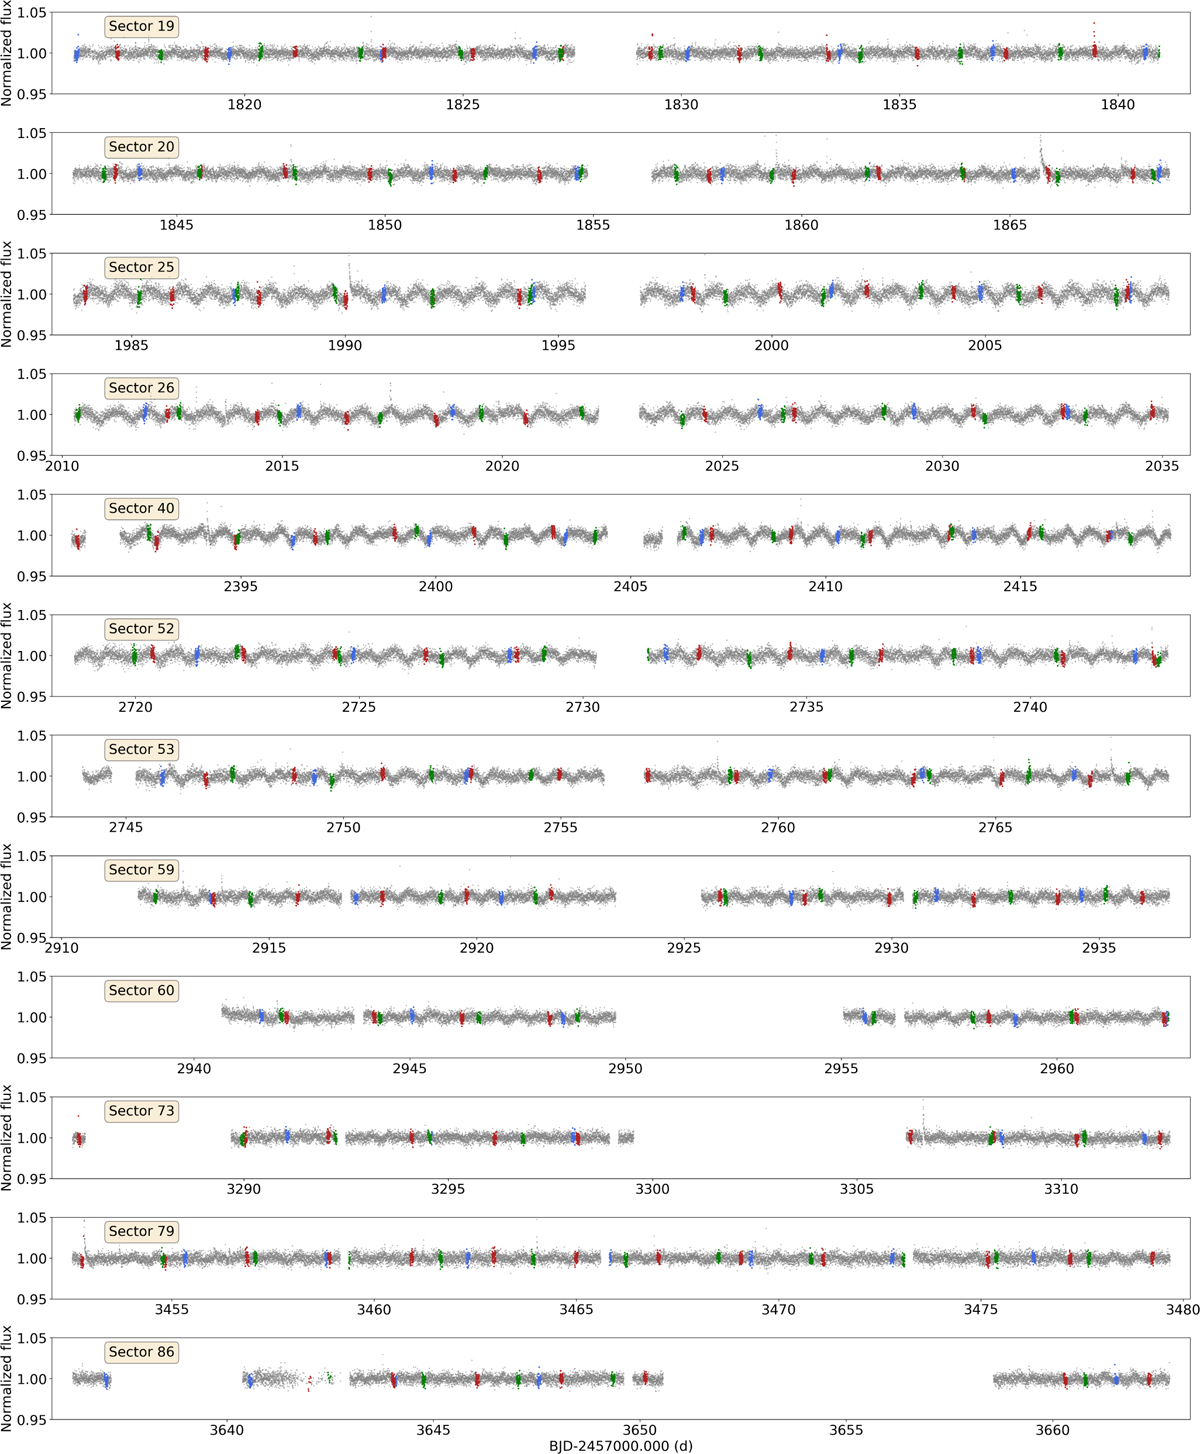
TESS photometric time series of TOI-2267 obtained for sectors 19, 20, 25, 26, 40, 52, 53, 59, 60, 73, 79, and 86. In all cases, the grey points correspond to the PDCSAP fluxes obtained from the SPOC pipeline. The blue, red and green points correspond to the location of the transits for the candidates TOI-2267.01, TOI-2267.02 and TOI-2267.03, respectively.
Current usage metrics show cumulative count of Article Views (full-text article views including HTML views, PDF and ePub downloads, according to the available data) and Abstracts Views on Vision4Press platform.
Data correspond to usage on the plateform after 2015. The current usage metrics is available 48-96 hours after online publication and is updated daily on week days.
Initial download of the metrics may take a while.