Fig. 2
Download original image
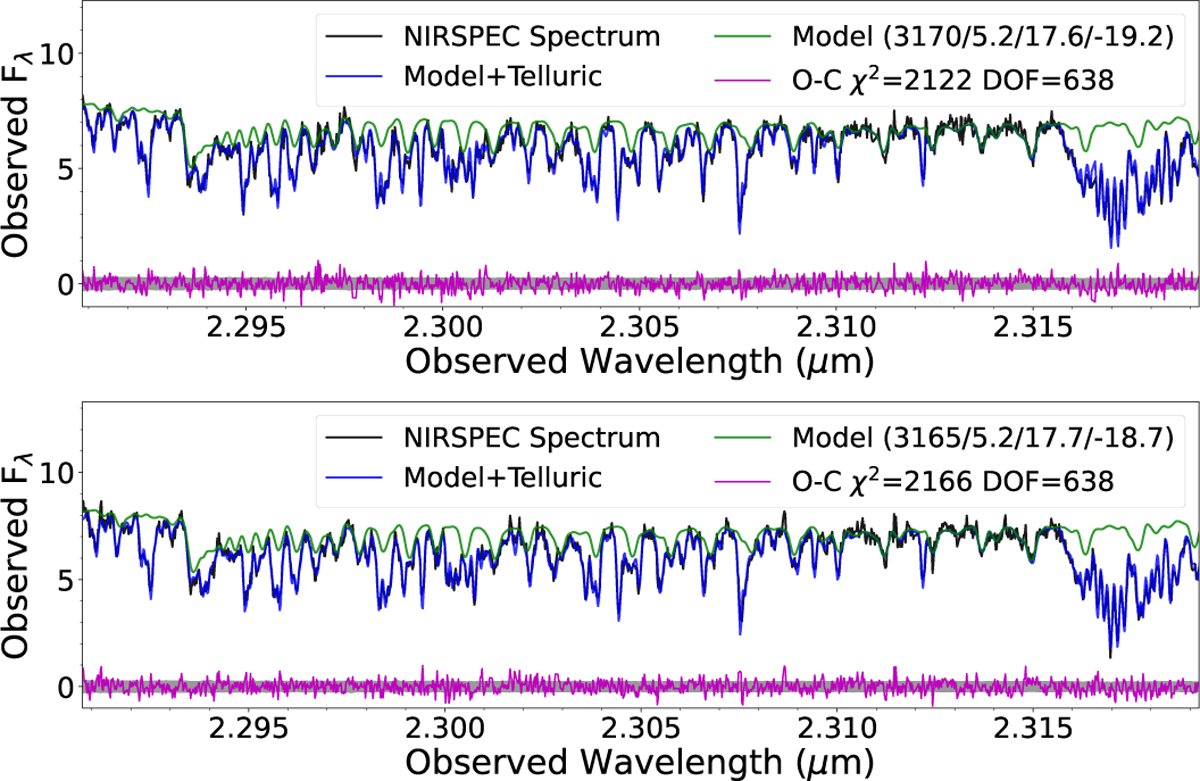
Keck/NIRSPEC K-band spectra of TOI-2267 around 2.3 μm. Top: observed NIRSPEC spectrum in the nodding position A (shown with the black line) with the data noise in the grey-shaded region. The stellar models with and without telluric absorption features are indicated with the blue and green lines, respectively. The residual (data – model) is denoted with the magenta line. Bottom: same as the top panel for NIRSPEC spectra and model fit but in the nodding position B.
Current usage metrics show cumulative count of Article Views (full-text article views including HTML views, PDF and ePub downloads, according to the available data) and Abstracts Views on Vision4Press platform.
Data correspond to usage on the plateform after 2015. The current usage metrics is available 48-96 hours after online publication and is updated daily on week days.
Initial download of the metrics may take a while.