Open Access
Fig. 6
Download original image
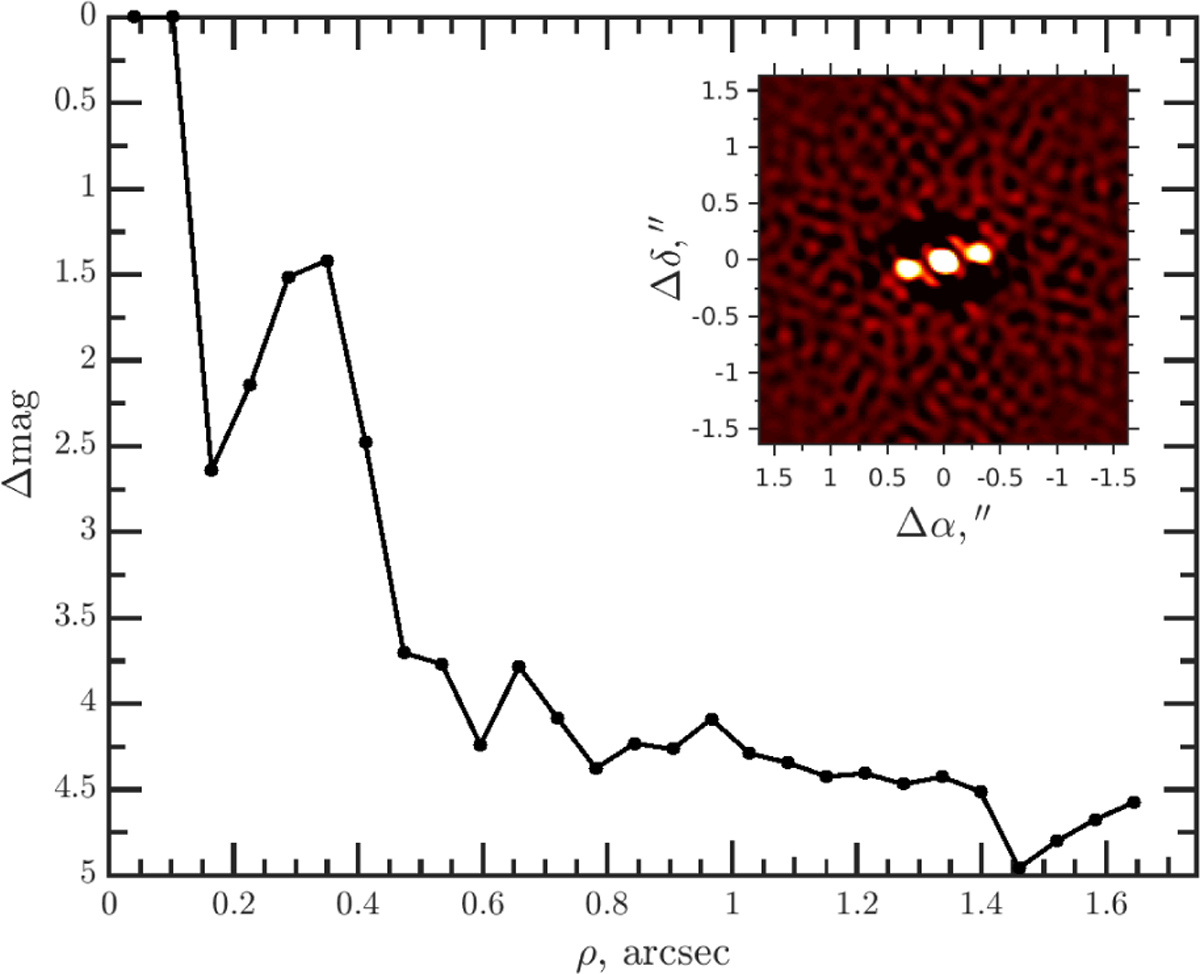
SAI-2.5m contrast curve for the observation obtained on 2024 August 09 UT. The bump at 0.3″ occurs due to the companion. The autocorrelation function is given in the inset.
Current usage metrics show cumulative count of Article Views (full-text article views including HTML views, PDF and ePub downloads, according to the available data) and Abstracts Views on Vision4Press platform.
Data correspond to usage on the plateform after 2015. The current usage metrics is available 48-96 hours after online publication and is updated daily on week days.
Initial download of the metrics may take a while.