Fig. 1.
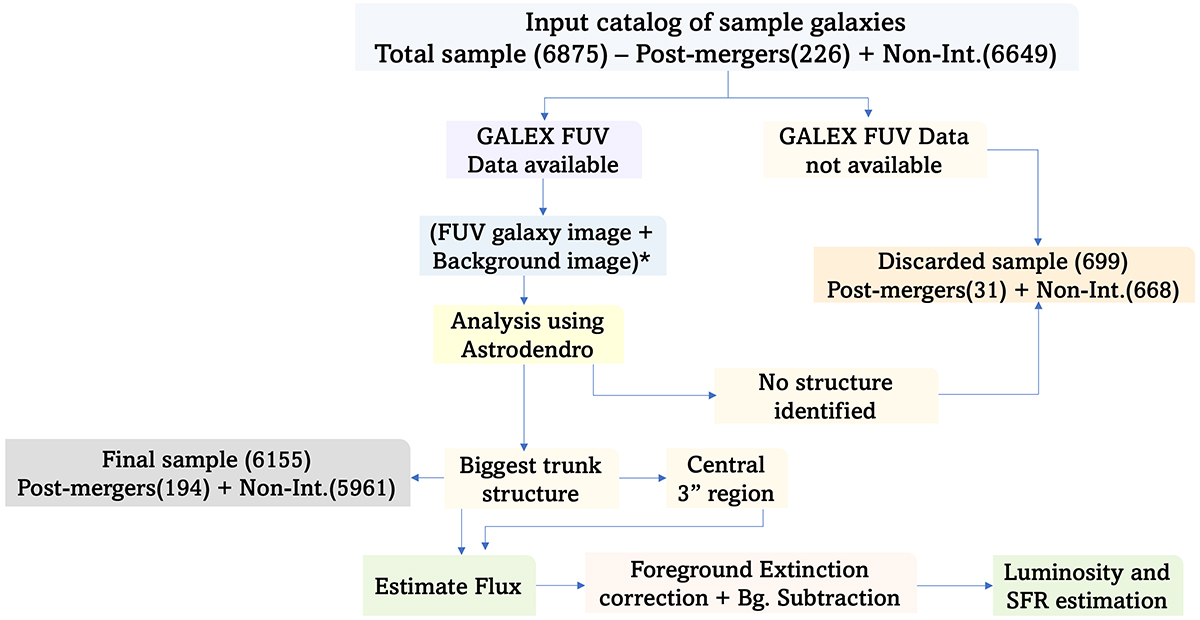
Download original image
Flowchart showing automated analysis of sample dwarfs step by step. For available data, we downloaded the FUV image containing the dwarf galaxy along with the corresponding background image. * If multiple FUV datasets were available, we downloaded the image with the maximum exposure. The subsequent analysis steps are detailed in Section 3.
Current usage metrics show cumulative count of Article Views (full-text article views including HTML views, PDF and ePub downloads, according to the available data) and Abstracts Views on Vision4Press platform.
Data correspond to usage on the plateform after 2015. The current usage metrics is available 48-96 hours after online publication and is updated daily on week days.
Initial download of the metrics may take a while.