Open Access
Fig. 6.
Download original image
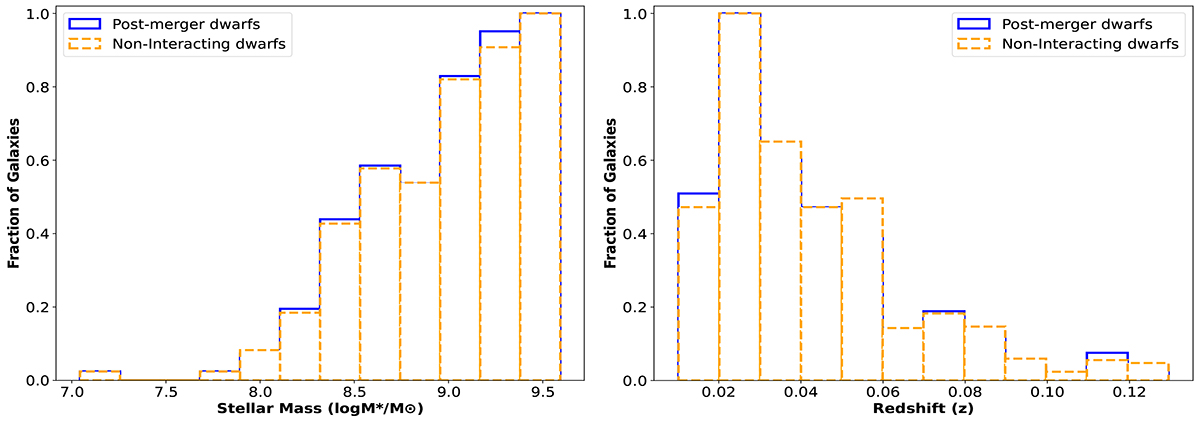
Histogram showing distribution of post-merger and non-interacting control dwarfs corresponding to stellar mass (left) and redshift (right). Post-merger galaxies are shown with blue solid lines, while non-interacting dwarfs are shown with orange dashed lines.
Current usage metrics show cumulative count of Article Views (full-text article views including HTML views, PDF and ePub downloads, according to the available data) and Abstracts Views on Vision4Press platform.
Data correspond to usage on the plateform after 2015. The current usage metrics is available 48-96 hours after online publication and is updated daily on week days.
Initial download of the metrics may take a while.