Fig. 8.
Download original image
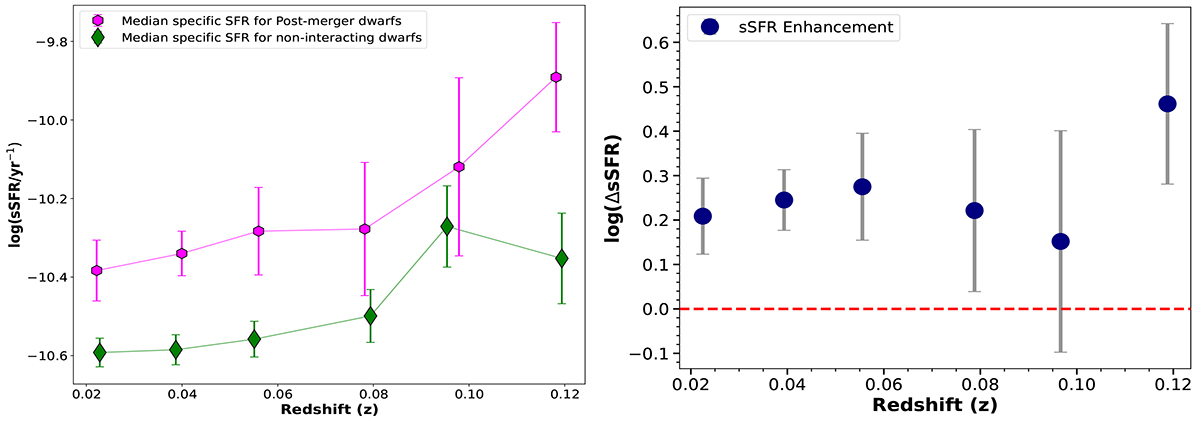
Left panel: sSFR-versus-redshift plot showing higher median sSFR for the post-merger dwarfs, and a mild increasing trend beyond z ∼ 0.08 for post-mergers. Right panel: Offset in sSFR, i.e. (log(ΔsSFR) = logsSFRpost − merger − logsSFRnon − interacting) between the post-merger and the corresponding non-interacting control dwarfs, as a function of redshift. The red dotted line denotes log(ΔsSFR) = 0. This plot demonstrates an enhancement in sSFR for post-merger dwarfs relative to matched controls at all redshifts.
Current usage metrics show cumulative count of Article Views (full-text article views including HTML views, PDF and ePub downloads, according to the available data) and Abstracts Views on Vision4Press platform.
Data correspond to usage on the plateform after 2015. The current usage metrics is available 48-96 hours after online publication and is updated daily on week days.
Initial download of the metrics may take a while.