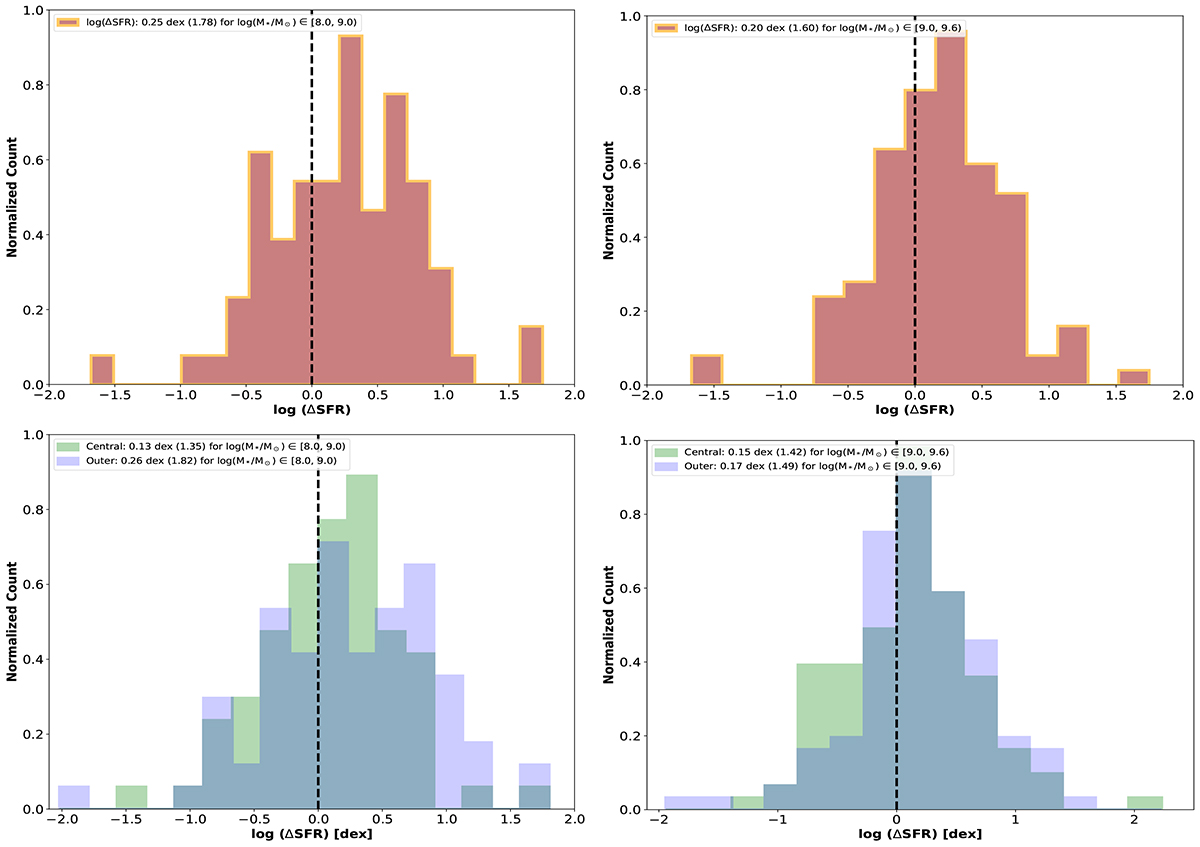
Fig. A.1.
Download original image
The plots comparing the difference in the SFR (log(ΔSFR) = logSFRpost − merger - logSFRnon − interacting) of the post-merger concerning their non-interacting control dwarfs. Left panel: This figure shows the histogram distribution of SFR offset for the entire galaxy, central, and outer regions for those dwarfs spanning a stellar mass range of 108 − 109M⊙. Right panel: This figure shows the histogram distribution of SFR offset for the visually identified dwarf galaxy sample, central and outer regions within a stellar mass range of 109 − 109.6M⊙.
Current usage metrics show cumulative count of Article Views (full-text article views including HTML views, PDF and ePub downloads, according to the available data) and Abstracts Views on Vision4Press platform.
Data correspond to usage on the plateform after 2015. The current usage metrics is available 48-96 hours after online publication and is updated daily on week days.
Initial download of the metrics may take a while.