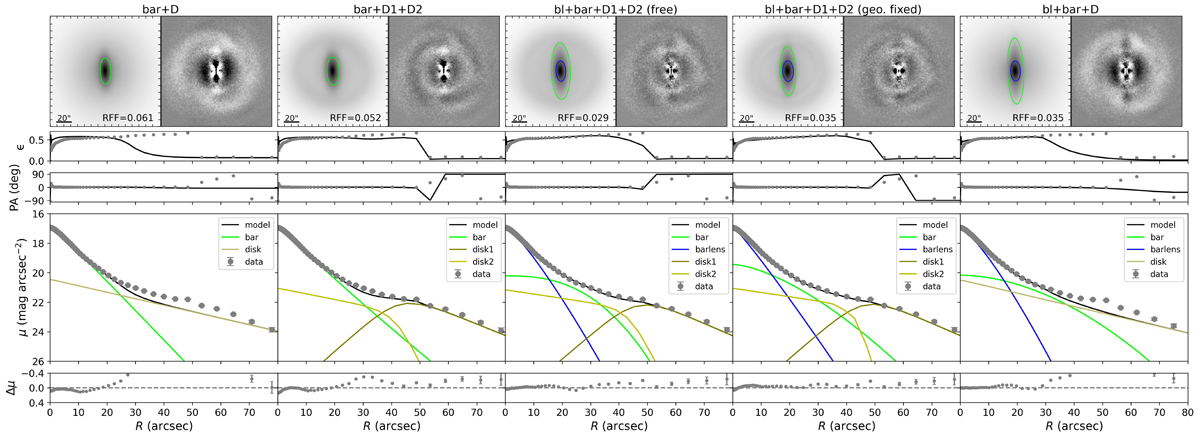
Fig. 3.
Download original image
Two-dimensional image decomposition results of the Model 1 mock image in the face-on view. In each column, the top row shows the best-fit 2D model image (left) and the residual image (right). The green and blue ellipses indicate the outlines of the bar and barlens, respectively, with semi-major axis of 2re. The other rows show results of the isophotal analysis, including the radial profiles of ellipticity (second row), the position angle (third row), the surface brightness (forth row), and the residual between data and the best-fit model (bottom row). From left to right, the fitting configuration are bar+D, bar+D1+D2, bl+bar+D1+D2 (free parameters fitting), and bl+bar+D1+D2 (fixing the size and axial ratio of the barlens), respectively (see details in the text). The fifth column (bl+bar+D) shows the result of the fitting with only one exponential disk. The RFF of each configuration is labeled in the model image.
Current usage metrics show cumulative count of Article Views (full-text article views including HTML views, PDF and ePub downloads, according to the available data) and Abstracts Views on Vision4Press platform.
Data correspond to usage on the plateform after 2015. The current usage metrics is available 48-96 hours after online publication and is updated daily on week days.
Initial download of the metrics may take a while.