Open Access
Fig. 2.
Download original image
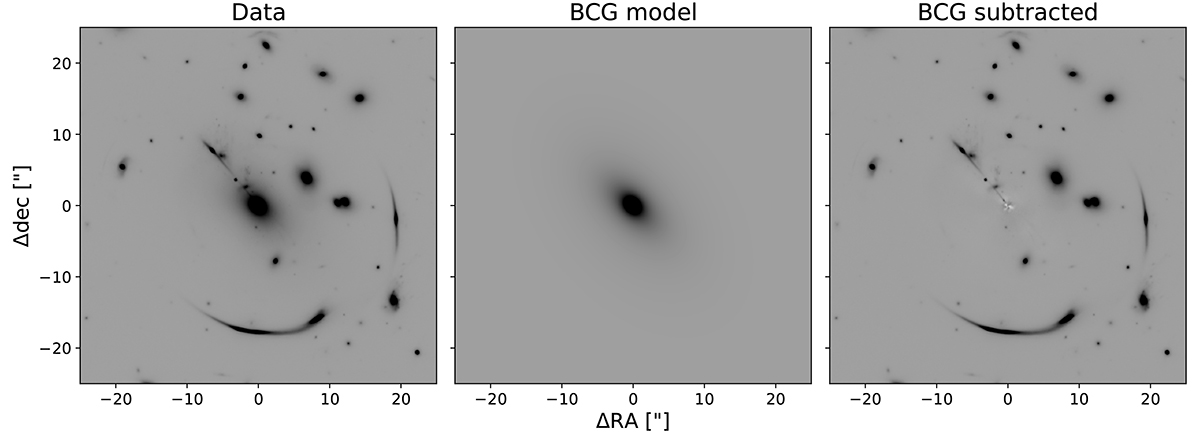
Results from modelling the BCG light with Sérsic profiles in the HST F160W filter. The left panel shows the observed image, the middle panel shows our BCG light model, and the right panel is the BCG subtracted image. The images cover the central 50″ × 50″ around the BCG.
Current usage metrics show cumulative count of Article Views (full-text article views including HTML views, PDF and ePub downloads, according to the available data) and Abstracts Views on Vision4Press platform.
Data correspond to usage on the plateform after 2015. The current usage metrics is available 48-96 hours after online publication and is updated daily on week days.
Initial download of the metrics may take a while.