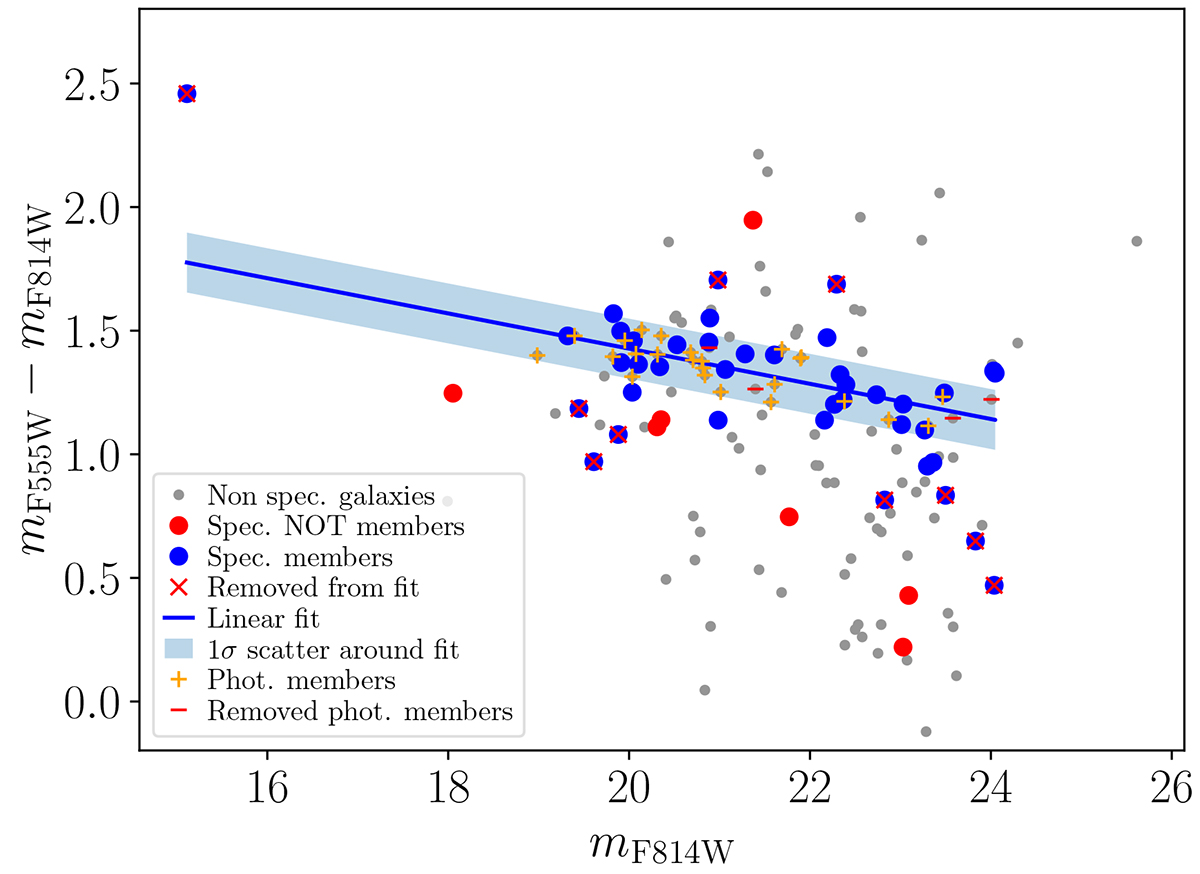
Fig. 5.
Download original image
Colour-magnitude diagram in the field of MACS J0138−2155. Spectroscopically confirmed cluster members and non-members are indicated as blue and red points, respectively. Sources with no spectroscopic confirmation are shown in grey. The blue line and region indicate the fitted red sequence and the 1σ scatter. Red crosses (X) mark cluster members that do not follow the red sequence and yellow plus signs indicate the photometrically selected members that are included in our lens model. Objects inside the red sequence with a red minus sign are not included as photometric cluster members due to the lack of, or unreliable, F160W photometry.
Current usage metrics show cumulative count of Article Views (full-text article views including HTML views, PDF and ePub downloads, according to the available data) and Abstracts Views on Vision4Press platform.
Data correspond to usage on the plateform after 2015. The current usage metrics is available 48-96 hours after online publication and is updated daily on week days.
Initial download of the metrics may take a while.