Fig. 6.
Download original image
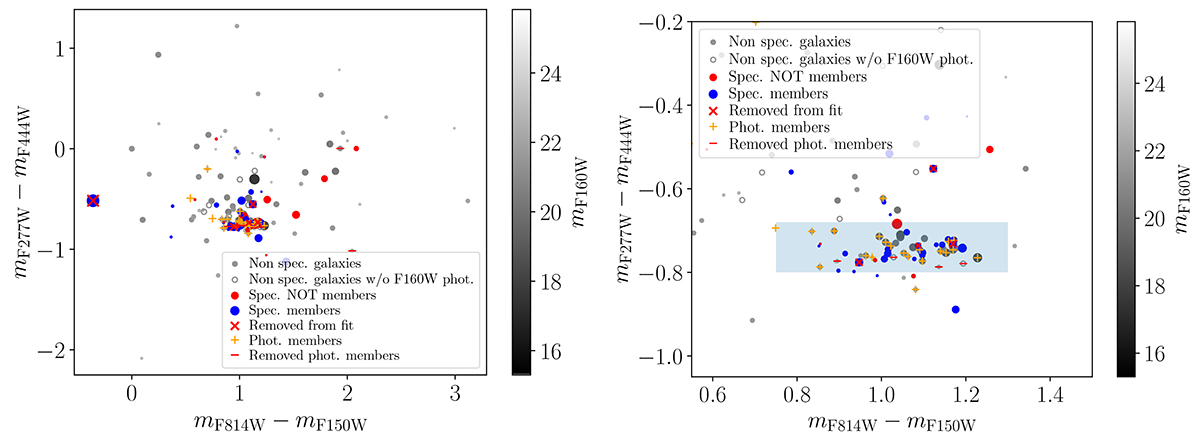
Colour-colour diagram in the field of MACS J0138−2155, where the right panel is a zoom-in of the left panel. Spectroscopically confirmed cluster members and non-members are indicated in blue and red, respectively. Sources with no spectroscopic confirmation are shown in grey, with size and shade related to the galaxy brightness as shown in the colour bar. Red crosses (X) mark spectroscopic cluster members that do not follow the red sequence and yellow plus signs indicate the colour-magnitude selected members (from Fig. 5) that are included in our lens model. Photometric galaxies inside the blue shaded region in the right-hand panel are selected as cluster members via our colour-colour selection.
Current usage metrics show cumulative count of Article Views (full-text article views including HTML views, PDF and ePub downloads, according to the available data) and Abstracts Views on Vision4Press platform.
Data correspond to usage on the plateform after 2015. The current usage metrics is available 48-96 hours after online publication and is updated daily on week days.
Initial download of the metrics may take a while.