Fig. 1
Download original image
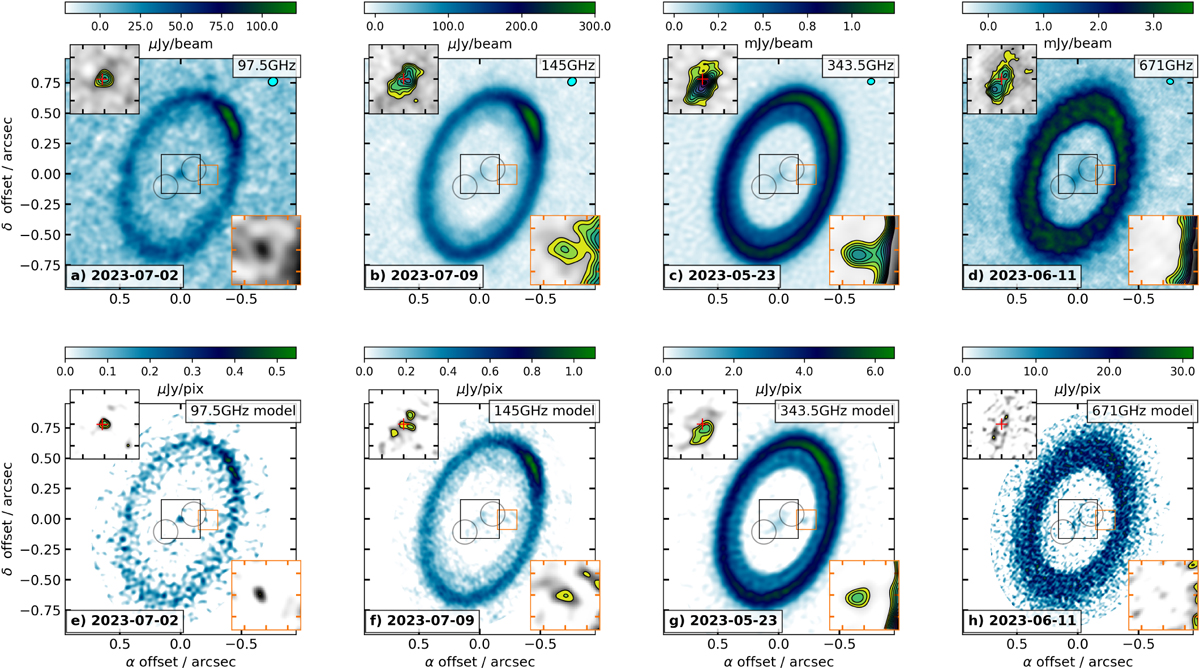
Multi-frequency imaging of PDS 70. The black insets at the top left of each image zoom on the central region (with tick-marks separated by 0".1), while the orange insets at the bottom right zoom on the expected position of PDS 70c for circular Keplerian rotation around a 0.97 M⊙ star (with tick-marks at 0″.05). The red plus symbol in the central inset marks the nominal position of the star. In all insets the linear grey scale stretches over the range of intensities in each region, and the contour levels start at 3 σ and are incremented in units of σ. Intensities within each contour level are colour-coded differently. The two circles are centred on the positions of PDS 70b and PDS 70d (no radio counterparts are detected). Images in a) to d), along the top row, correspond to restorations of the corresponding non-parametric model images (that fit the visibility data), in e) to h), along the bottom row. A beam ellipse in a) to d) is shown in blue, on the top right. The pixel size in the model images is fixed at 4 × 4 mas2. For each band the Briggs parameter used for the restoration, the clean bean and the noise can be found in Table 2.
Current usage metrics show cumulative count of Article Views (full-text article views including HTML views, PDF and ePub downloads, according to the available data) and Abstracts Views on Vision4Press platform.
Data correspond to usage on the plateform after 2015. The current usage metrics is available 48-96 hours after online publication and is updated daily on week days.
Initial download of the metrics may take a while.