Fig. 15
Download original image
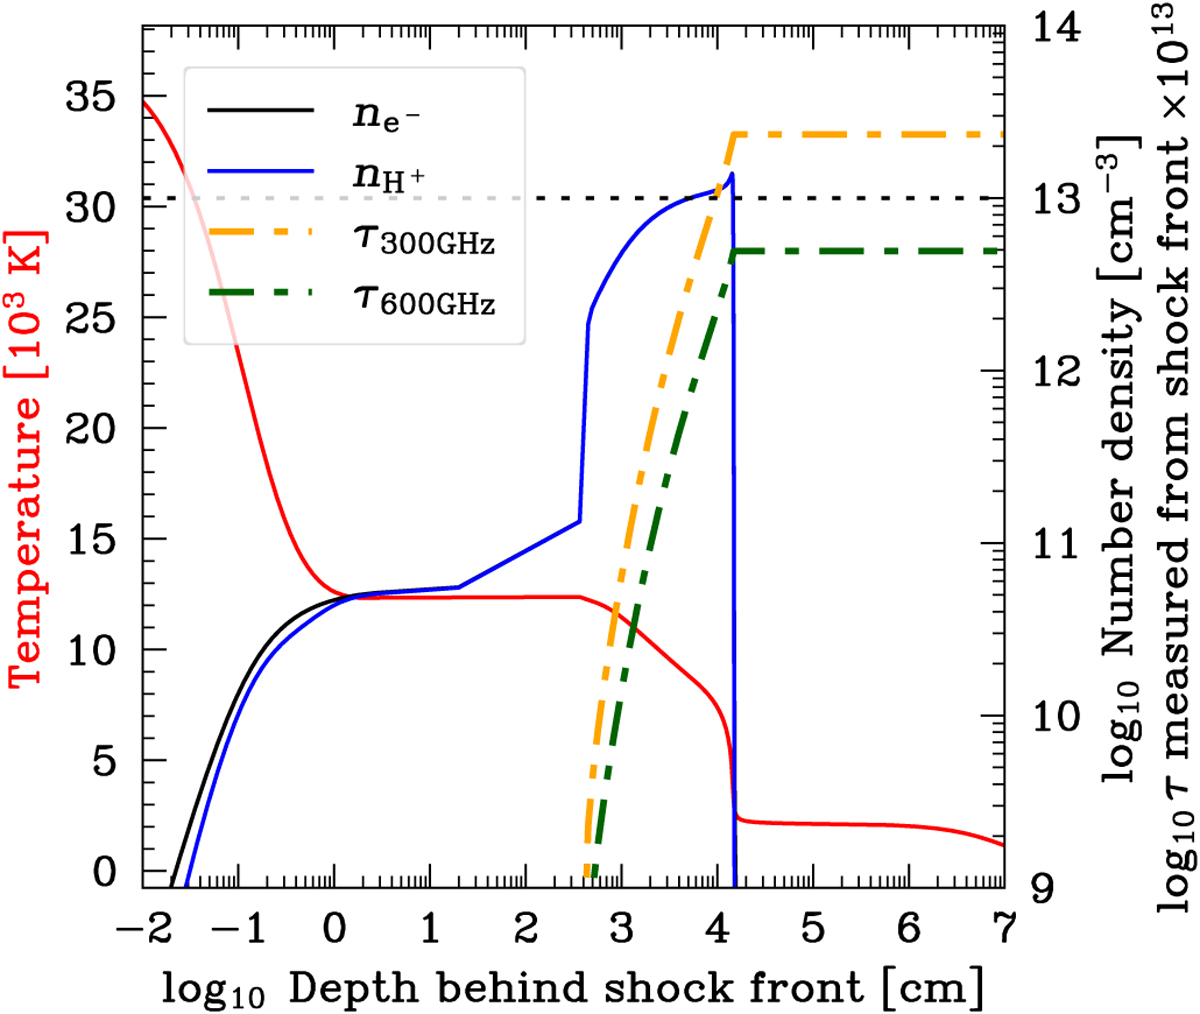
Physical conditions of the post-shock region for υ0 = 30 km s−1 and n0 = 1015cc−1. The temperature, free electron local density (ne−), and HII local density (nH+) are the solid red, black, and blue lines, respectively. The optical depths at 300 and 600 GHz (τ300GHz and τ600GHz) are the dashed green and yellow lines, where the dotted black line corresponds to τ = 1.
Current usage metrics show cumulative count of Article Views (full-text article views including HTML views, PDF and ePub downloads, according to the available data) and Abstracts Views on Vision4Press platform.
Data correspond to usage on the plateform after 2015. The current usage metrics is available 48-96 hours after online publication and is updated daily on week days.
Initial download of the metrics may take a while.