Fig. 3
Download original image
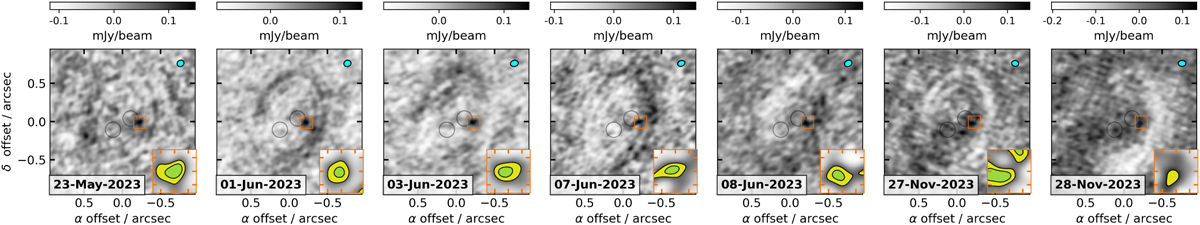
Dirty maps in natural weights of the residual Band 7 visibilities, after subtraction of the disc. The grey scale stretches over the full intensity scale, and for each of seven epochs. The inset zooms into PDS 70c, with contours at 90 and 120 μJy beam−1, fixed for ease of comparison across epochs. As in Fig. 1, the circles are centred on PDS 70b and d, and are drawn here to ease the search for any variable counterparts.
Current usage metrics show cumulative count of Article Views (full-text article views including HTML views, PDF and ePub downloads, according to the available data) and Abstracts Views on Vision4Press platform.
Data correspond to usage on the plateform after 2015. The current usage metrics is available 48-96 hours after online publication and is updated daily on week days.
Initial download of the metrics may take a while.