Fig. 5
Download original image
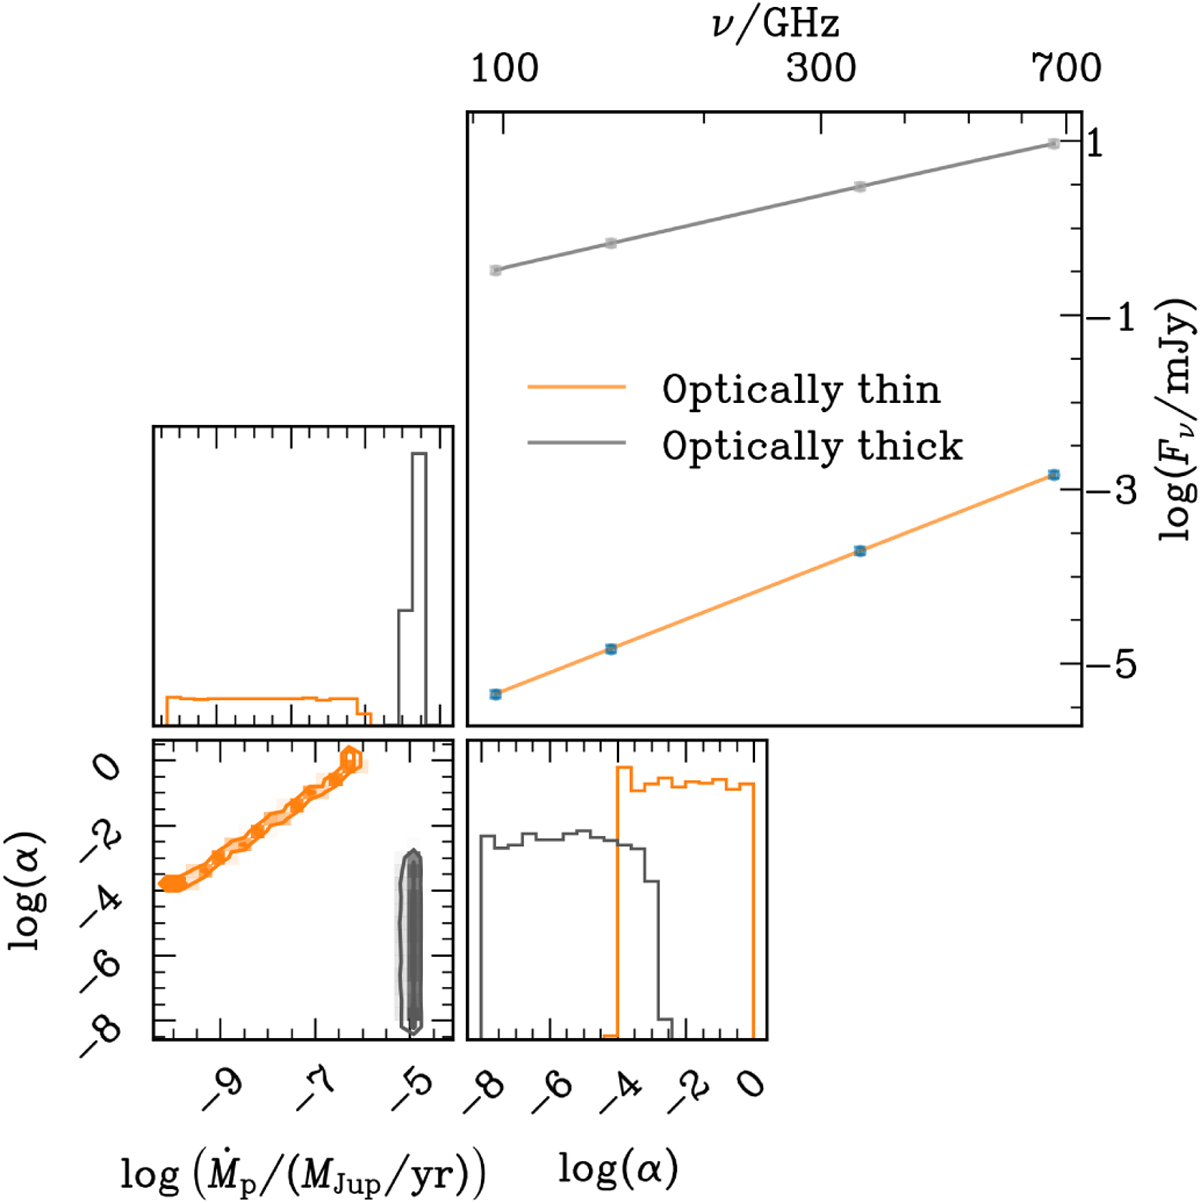
Corner plot for synthetic data. The orange posteriors show the synthetic optically thin case, calculated with Ṁp = 10−9 MJup yr−1 and α = 10−3. The outcome illustrates the degeneracy between Ṁp and α inherent to the parametric CPD model of Zhu et al. (2018). The grey posteriors show the synthetic optically thick case, calculated with Ṁp = 10−5 MJupyr−1 (and the same α = 10−3). Both synthetic SEDs were obtained using only the dust component of the CPD model following Zhu et al. (2018), with errors set to 10% of the flux.
Current usage metrics show cumulative count of Article Views (full-text article views including HTML views, PDF and ePub downloads, according to the available data) and Abstracts Views on Vision4Press platform.
Data correspond to usage on the plateform after 2015. The current usage metrics is available 48-96 hours after online publication and is updated daily on week days.
Initial download of the metrics may take a while.