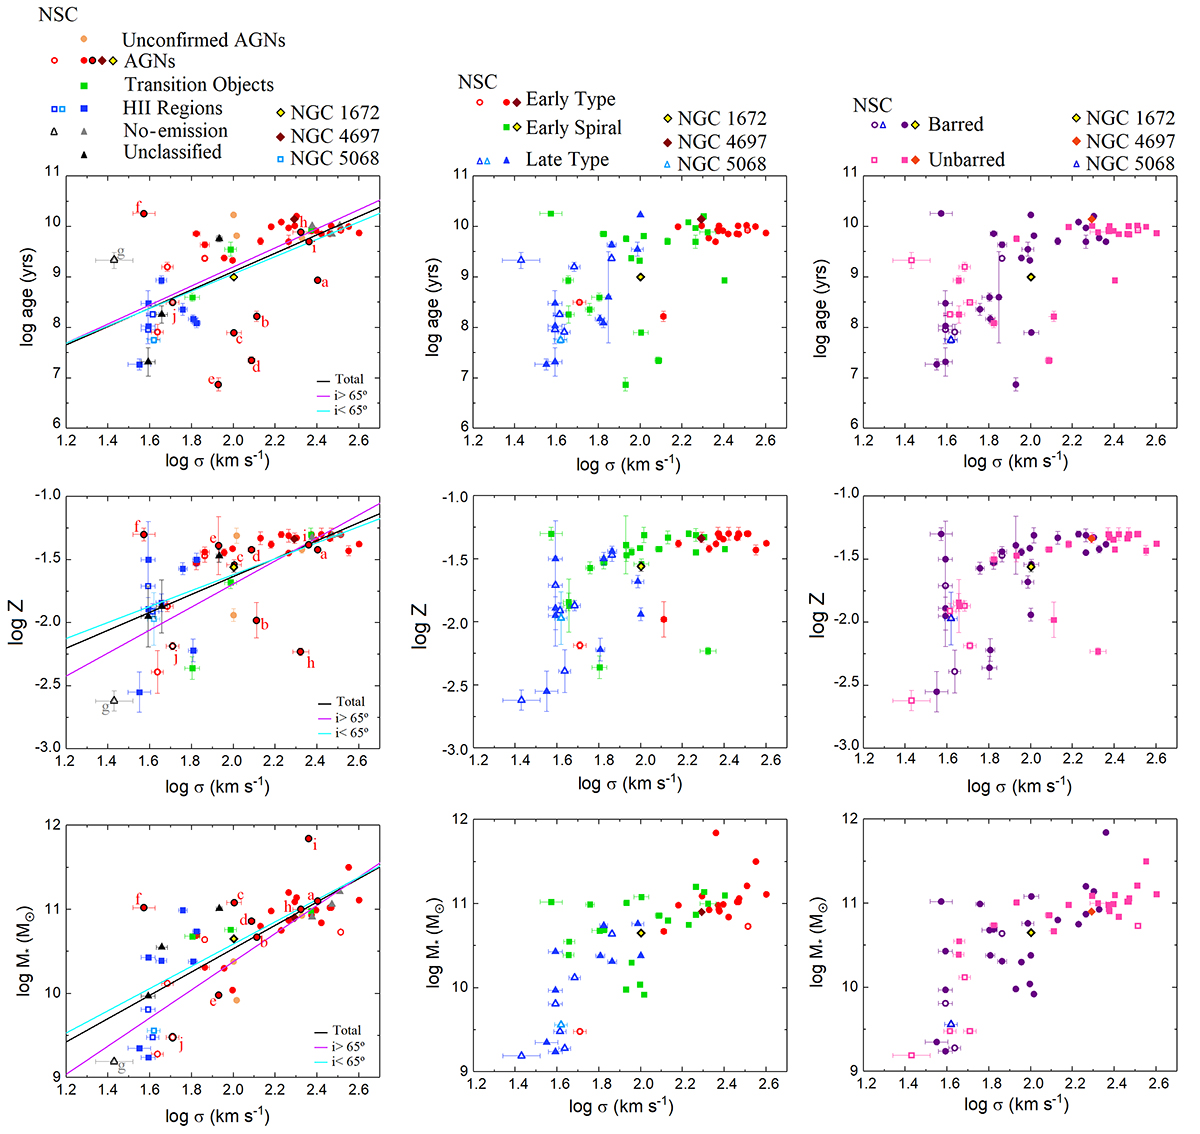
Fig. 2.
Download original image
Age, metallicity, and total stellar mass versus the nuclear stellar velocity dispersion. The sample is divided in groups, according to their features: nuclear activity, morphology, and bar presence, each one shown in the captions of each panel. According to Hoyer et al. (2021), this sample of galaxies contains nine galaxies with nuclear stellar clusters, which are represented by the open points. Panels on the left show the fits considering the total sample (black), sample with inclinations higher than 65° (purple), and sample with inclinations lower than 65° (cyan). There is also the indication of three galaxies used as example in Fig. 1. Letters a, b, c, d, e, f, and g next to points represent the following outliers of the plot log(age) versus log(σ): NGC 4594 (a), NGC 5128 (b), NGC 613 (c), NGC 1068 (d), NGC 1566 (e), NGC 1365 (f), NGC 300 (g). Here, h corresponds to the outlier NGC 7213 in the plot of log(Z) versus log(σ), i represents the outlier NGC 1316 in the plot of log(M*) versus log(σ), and j corresponds to NGC 5102, which is an outlier in the plots of morphological types.
Current usage metrics show cumulative count of Article Views (full-text article views including HTML views, PDF and ePub downloads, according to the available data) and Abstracts Views on Vision4Press platform.
Data correspond to usage on the plateform after 2015. The current usage metrics is available 48-96 hours after online publication and is updated daily on week days.
Initial download of the metrics may take a while.