Open Access
Fig. 1.
Download original image
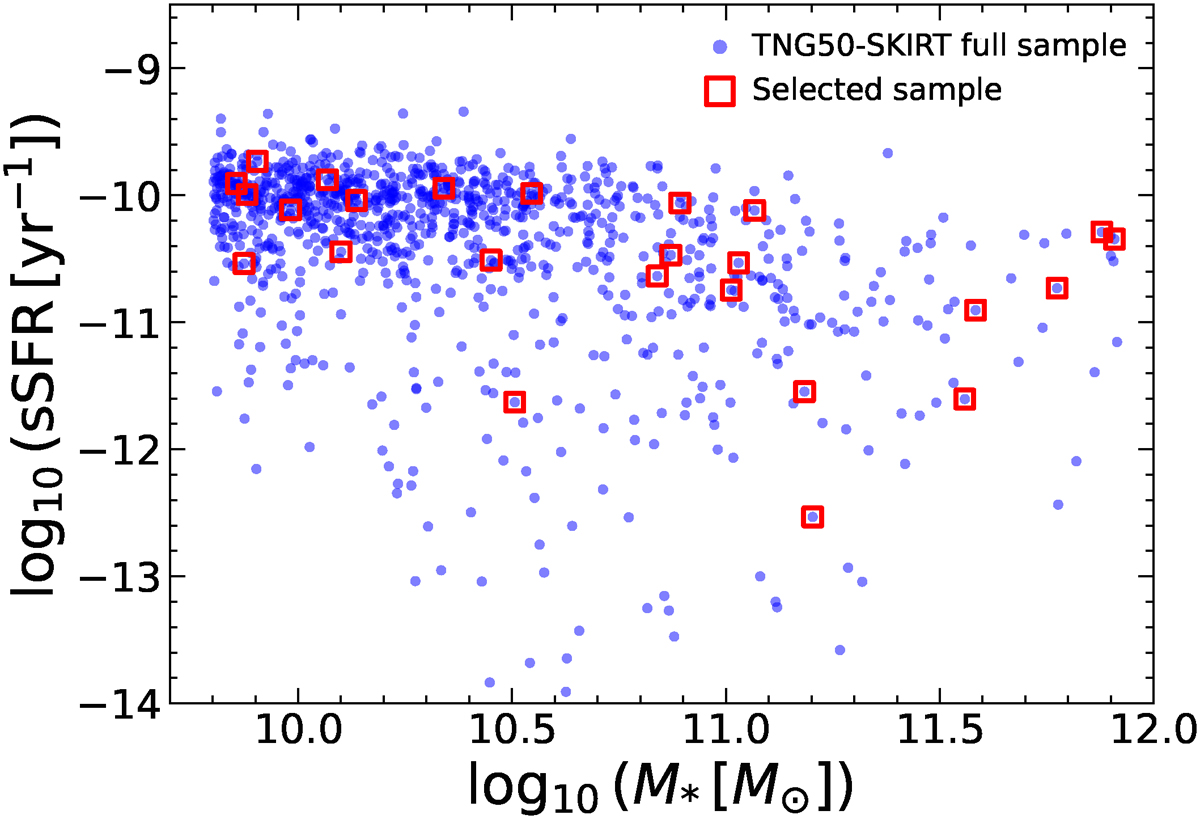
The Sample of 25 simulated galaxies used for the analyses in this paper. The selected sample and the parent sample from the TNG50-SKIRT Atlas are shown with red squares and blue dots, respectively. The sample is selected to cover the entire mass range in the TNG50-SKIRT catalogue and a wide range of sSFR.
Current usage metrics show cumulative count of Article Views (full-text article views including HTML views, PDF and ePub downloads, according to the available data) and Abstracts Views on Vision4Press platform.
Data correspond to usage on the plateform after 2015. The current usage metrics is available 48-96 hours after online publication and is updated daily on week days.
Initial download of the metrics may take a while.