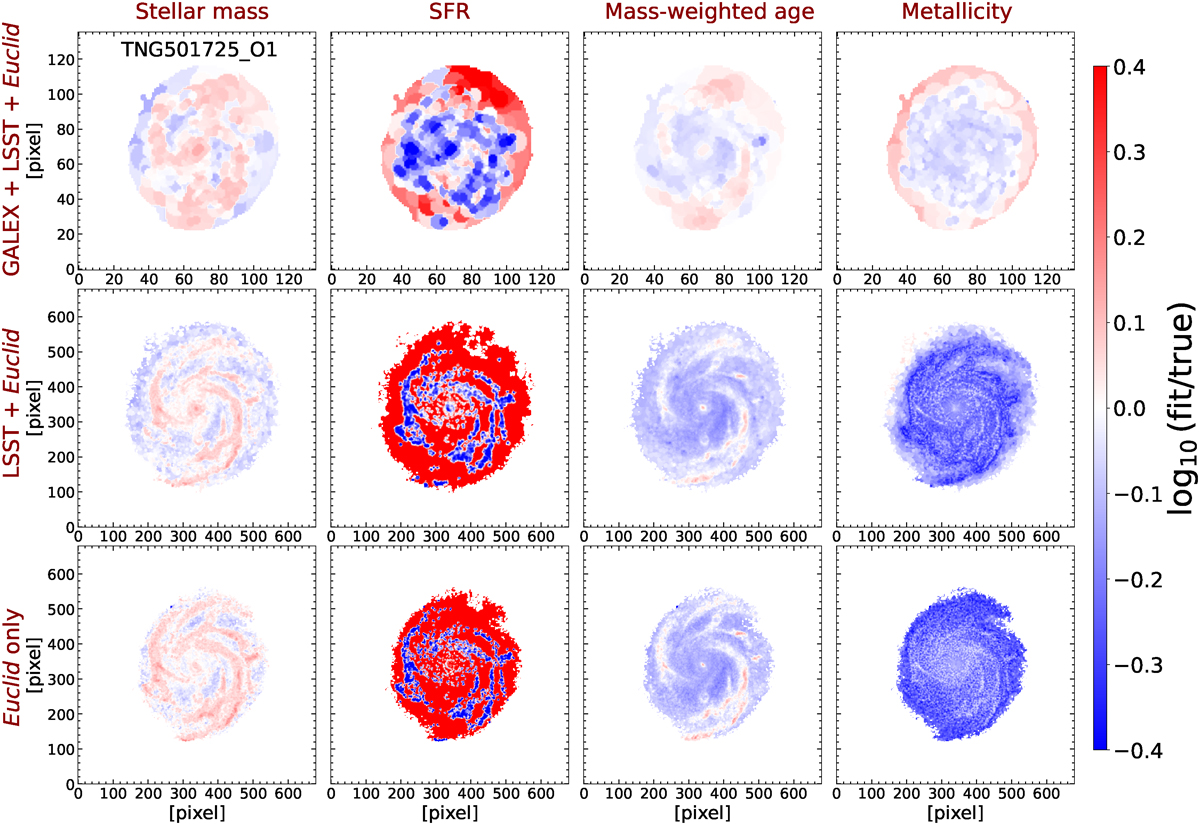
Fig. 10.
Download original image
Examples of spatially resolved distributions of the systematic offsets (in logarithmic scale) between the parameters derived from SED fitting and the true values. Offset maps of a galaxy TNG501725, are shown here for example. The first, second, and third rows are for analyses with G + L + E, L + E, and E data cubes, respectively. Only results obtained with the FSPS model and applying the mass-Z-age prior are shown.
Current usage metrics show cumulative count of Article Views (full-text article views including HTML views, PDF and ePub downloads, according to the available data) and Abstracts Views on Vision4Press platform.
Data correspond to usage on the plateform after 2015. The current usage metrics is available 48-96 hours after online publication and is updated daily on week days.
Initial download of the metrics may take a while.