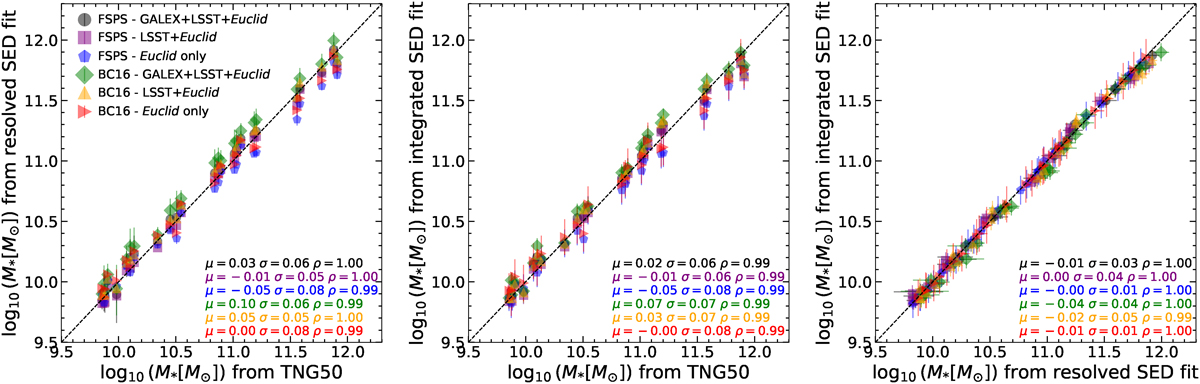
Fig. 12.
Download original image
The Robustness of integrated M∗ derived from the spatially resolved SED fitting and the integrated SED fitting compared to the true M∗ from the TNG50 simulation. Left panel: Comparison between M∗ derived from spatially resolved SED fitting (i.e. by summing up M∗ of pixels within the ROI of the galaxies) and the true values. Middle panel: Comparison between M∗ derived from integrated SED fitting and the true values. Right panel: Comparison between integrated M∗ from spatially resolved and integrated SED fitting.
Current usage metrics show cumulative count of Article Views (full-text article views including HTML views, PDF and ePub downloads, according to the available data) and Abstracts Views on Vision4Press platform.
Data correspond to usage on the plateform after 2015. The current usage metrics is available 48-96 hours after online publication and is updated daily on week days.
Initial download of the metrics may take a while.