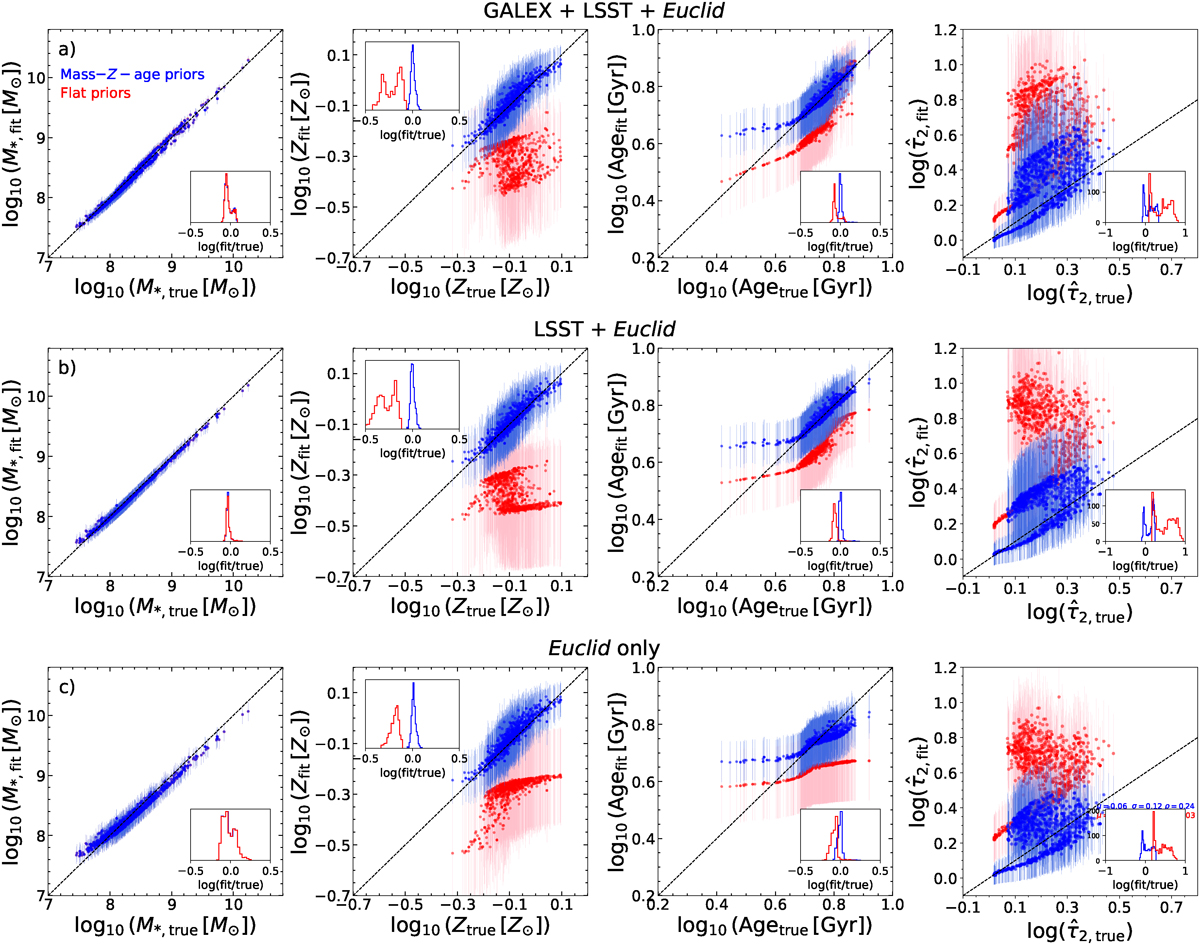
Fig. B.1.
Download original image
Results of SED fitting tests using simple mock SEDs generated with FSPS. Three sets of mock SEDs are made: G + L + E, L + E, and E, and the results of fitting on them are shown in the top, middle, and bottom rows, respectively. We also fit the mock data with and without applying the mass-age and mass-Z priors and the results are shown in blue and red colours, respectively. The histograms in the insets show ratios (in logarithmic scale) between the best-fit and true values.
Current usage metrics show cumulative count of Article Views (full-text article views including HTML views, PDF and ePub downloads, according to the available data) and Abstracts Views on Vision4Press platform.
Data correspond to usage on the plateform after 2015. The current usage metrics is available 48-96 hours after online publication and is updated daily on week days.
Initial download of the metrics may take a while.