Fig. 10
Download original image
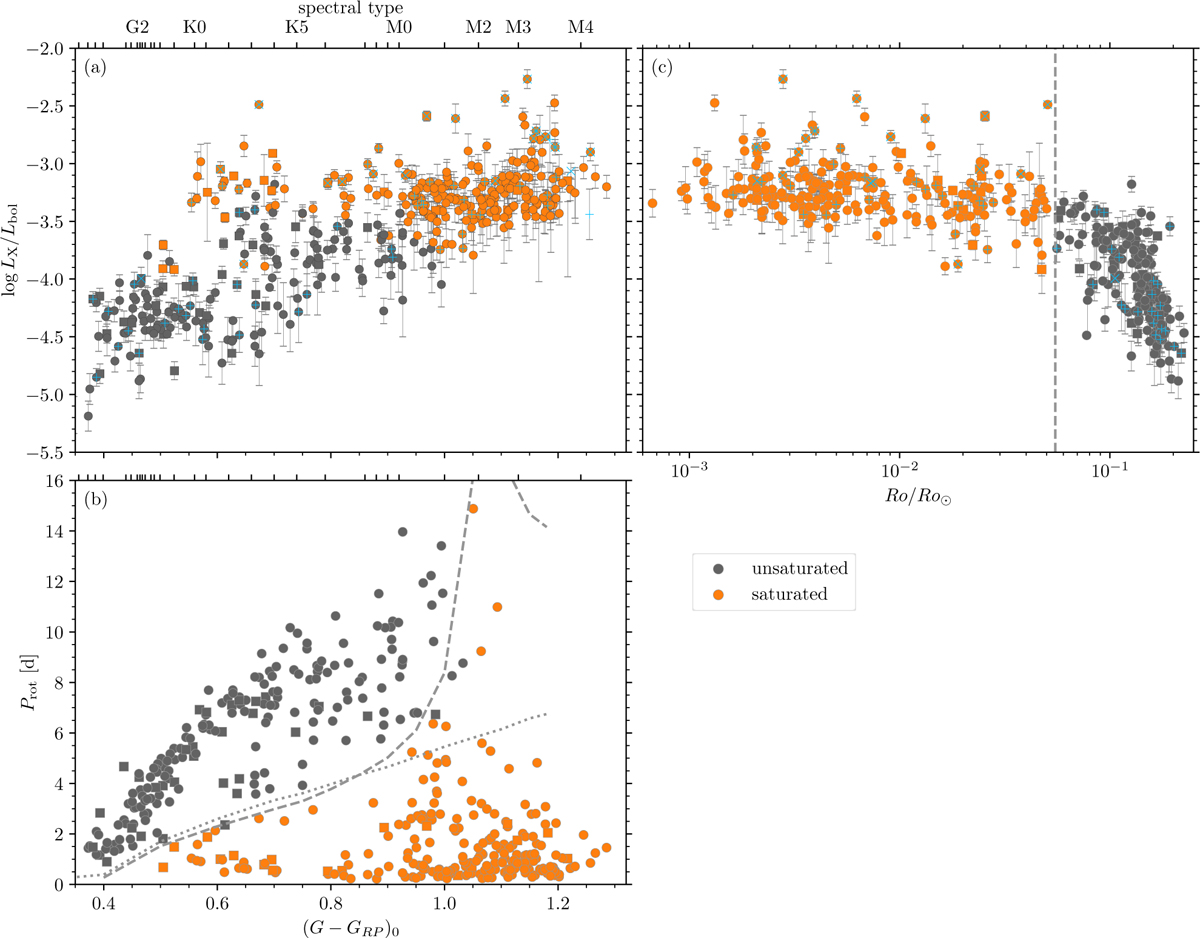
Connections between colour, activity, and rotation in the traditional interpretation, wherein stars are classified into two categories, saturated and unsaturated. (Only cluster members with both rotation periods and X-ray detections are plotted in a 3-way layout, allowing individual stars to be cross-identified across panels.) Panel (a) (top left) shows the colour-activity diagram. As in Fig. 7, members with identified flares in their light curves are marked with blue x-shaped symbols, and members with two potential optical counterparts with blue pluses. Panel (b) (bottom left): the corresponding colour-period diagram, indicating dividing lines of equal Rossby number separating saturated and unsaturated stars. Lines for Ro/Ro⊙ = 0.055 are displayed for the Barnes & Kim (2010) (dashed line) and Cranmer & Saar (2011) (dotted line) prescriptions. The four stars marked unsaturated below the separating line are the result of using a different colour to transform to the convective turnover timescale (see text). Panel (c) (top right): the corresponding rotation-activity diagram for the cluster members with measured rotation periods. The vertical line separating saturated and unsaturated stars corresponds to the line Ro/Ro⊙ = 0.055 in the CPD.
Current usage metrics show cumulative count of Article Views (full-text article views including HTML views, PDF and ePub downloads, according to the available data) and Abstracts Views on Vision4Press platform.
Data correspond to usage on the plateform after 2015. The current usage metrics is available 48-96 hours after online publication and is updated daily on week days.
Initial download of the metrics may take a while.