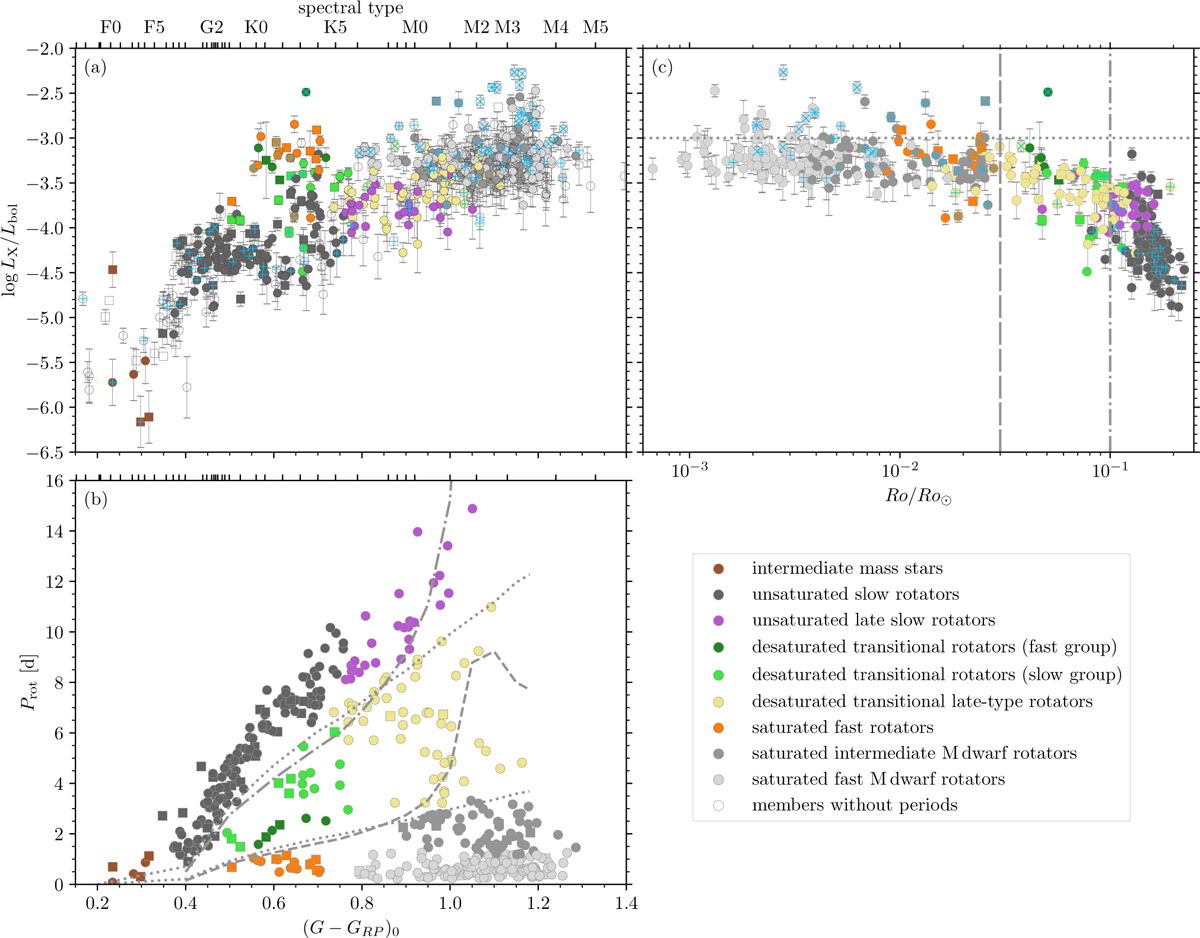
Fig. 11
Download original image
Three-way connections between colour, activity, and rotation, but with more nuanced separations than traditional. Panel (a) shows the X-ray colour-activity diagram with stars colour-coded by rotational properties (top left; also see key). As in Fig. 8, members with identified flares in their light curves are marked with x-shaped symbols, and members with two potential optical counterparts with pluses. Panel b: colour-period diagram in which the different rotators are defined (bottom left). The lines in the CPD are lines of constant normalised Rossby number, and are located at Ro/Ro⊙ = 0.03 and 0.1, indicating respectively the transition from saturated to desaturated stars, and then to unsaturated stars. A pile-up of rotation periods for early Mdwarfs just below the line can be seen. The dash-dotted line at longer rotation periods indicates the limit to the unsaturated stars. The two dotted lines show the lines of equal Rossby number at the same Ro/Ro⊙ positions but using τc from Cranmer & Saar (2011). Panel c: rotation-activity diagram for cluster members with their rotation periods available (top right). The two vertical lines again correspond to the lines in the CPD, at Ro/Ro⊙ = 0.03 and 0.1.
Current usage metrics show cumulative count of Article Views (full-text article views including HTML views, PDF and ePub downloads, according to the available data) and Abstracts Views on Vision4Press platform.
Data correspond to usage on the plateform after 2015. The current usage metrics is available 48-96 hours after online publication and is updated daily on week days.
Initial download of the metrics may take a while.