Fig. 12
Download original image
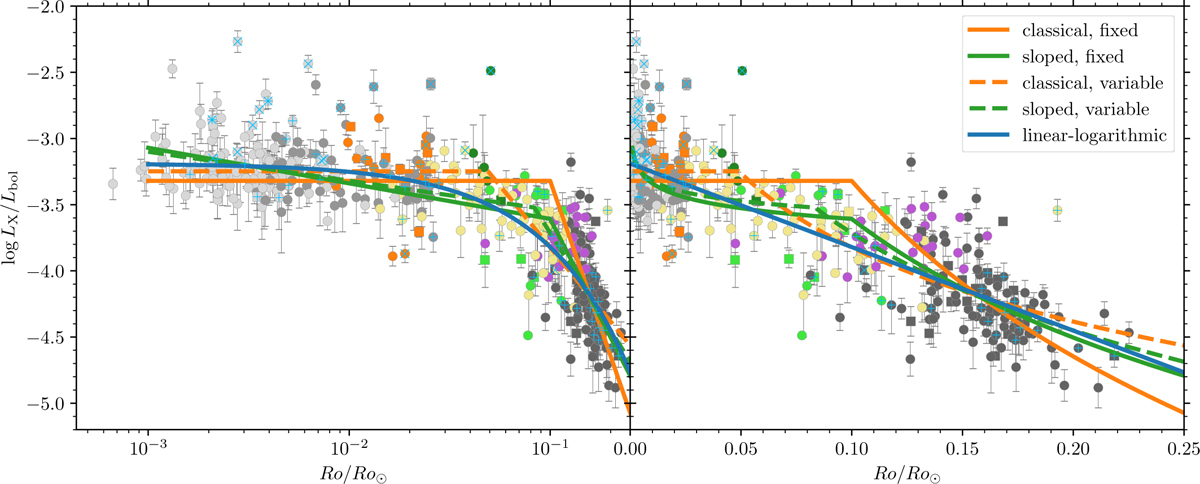
Rotation-activity diagram as in Fig. 11c, but now displaying different possible models for the rotation-activity relationship. The orange lines show classical segmented power law fits with a constant saturated regime, while green lines show power law fits with a slope in the saturated regime. The solid (green and orange) lines have a fixed break point at Ro/Ro⊙0 = 0.1, while it is a free model parameter for the models shown with the dashed lines. The blue line shows the linear-logarithmic model. It is remarkable that a 2-parameter fit can come closest to describing the X-ray behaviour of such a wide range of stars. Both panels show the same content, logarithmic with Ro/Ro⊙ (left) and linear with Ro/Ro⊙ (right). For clarity, we do not show the fits to the unsaturated regime alone.
Current usage metrics show cumulative count of Article Views (full-text article views including HTML views, PDF and ePub downloads, according to the available data) and Abstracts Views on Vision4Press platform.
Data correspond to usage on the plateform after 2015. The current usage metrics is available 48-96 hours after online publication and is updated daily on week days.
Initial download of the metrics may take a while.