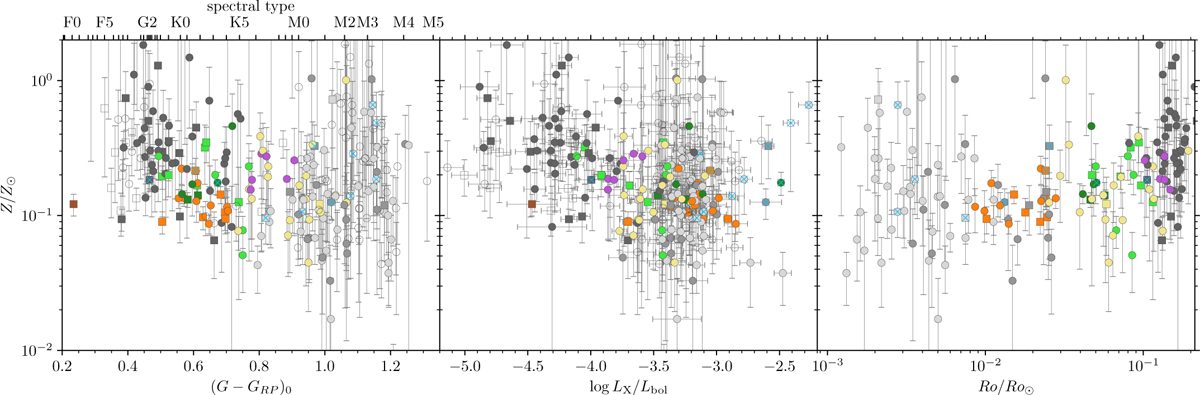
Fig. 14
Download original image
Coronal abundances against three independent variables, similar to Fig. 13. Left: plotting abundances against intrinsic Gaia (G − GRP)0 colour, we find marginally depressed abundances for late-K and early-M stars, although with a large scatter. Colours and symbols are as in Fig. 11. Centre: plotting against LX/Lbol suggests that the highest coronal abundances are found among inactive stars. Right: plotting abundances against solar-scaled Rossby number (Ro/Ro⊙) indicates that marginally higher coronal abundances are found for stars with the highest and lowest values of Ro/Ro⊙.
Current usage metrics show cumulative count of Article Views (full-text article views including HTML views, PDF and ePub downloads, according to the available data) and Abstracts Views on Vision4Press platform.
Data correspond to usage on the plateform after 2015. The current usage metrics is available 48-96 hours after online publication and is updated daily on week days.
Initial download of the metrics may take a while.