Fig. C.1
Download original image
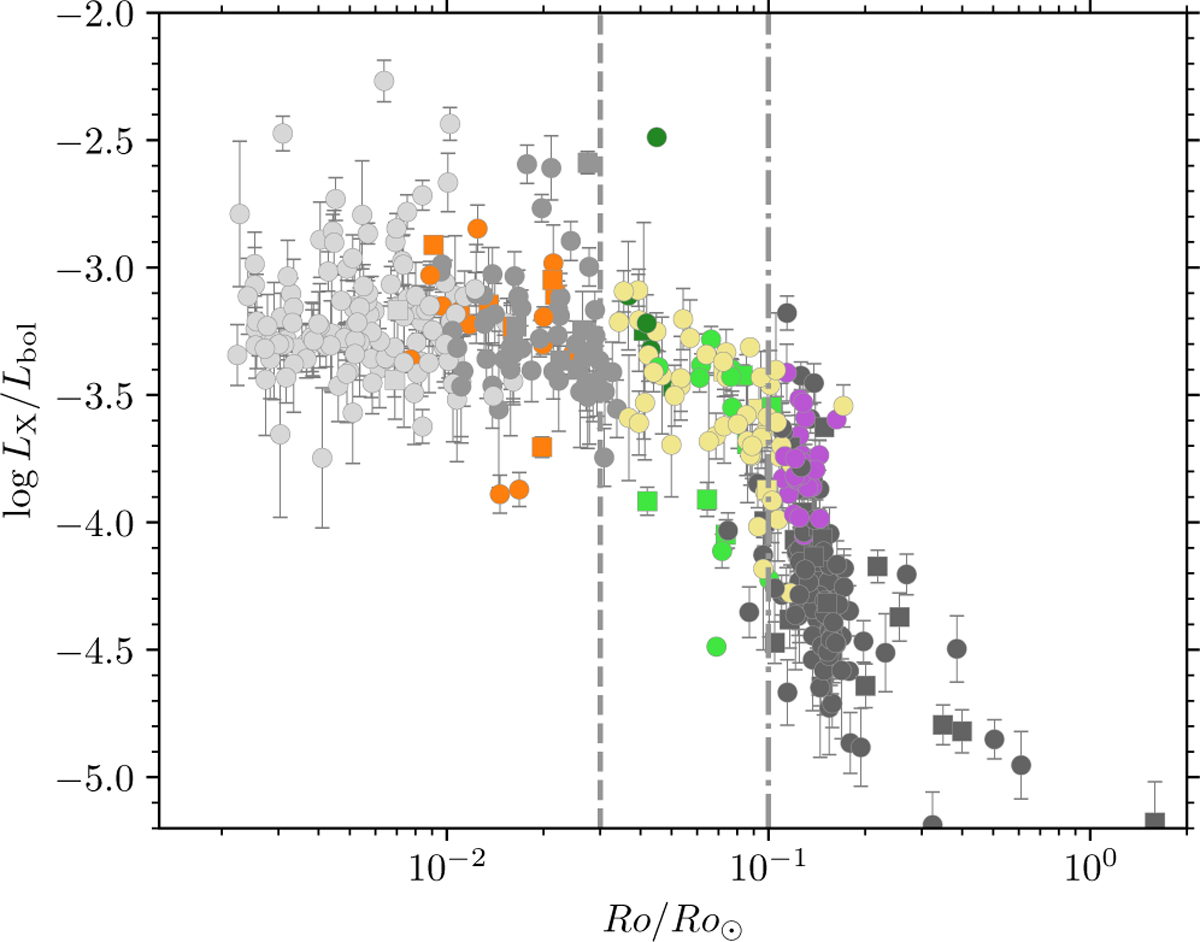
Rotation-activity diagram as in Fig. 11, but here using the convective turnover timescale from Cranmer & Saar (2011). The vertical lines at Ro/Ro⊙ = 0.03 and 0.1 again represent the transition values from saturated to desaturated and desaturated to unsaturated stars, respectively. This is a consequence and a benefit of the usage of the rescaled Rossby number.
Current usage metrics show cumulative count of Article Views (full-text article views including HTML views, PDF and ePub downloads, according to the available data) and Abstracts Views on Vision4Press platform.
Data correspond to usage on the plateform after 2015. The current usage metrics is available 48-96 hours after online publication and is updated daily on week days.
Initial download of the metrics may take a while.