Open Access
Fig. 2
Download original image
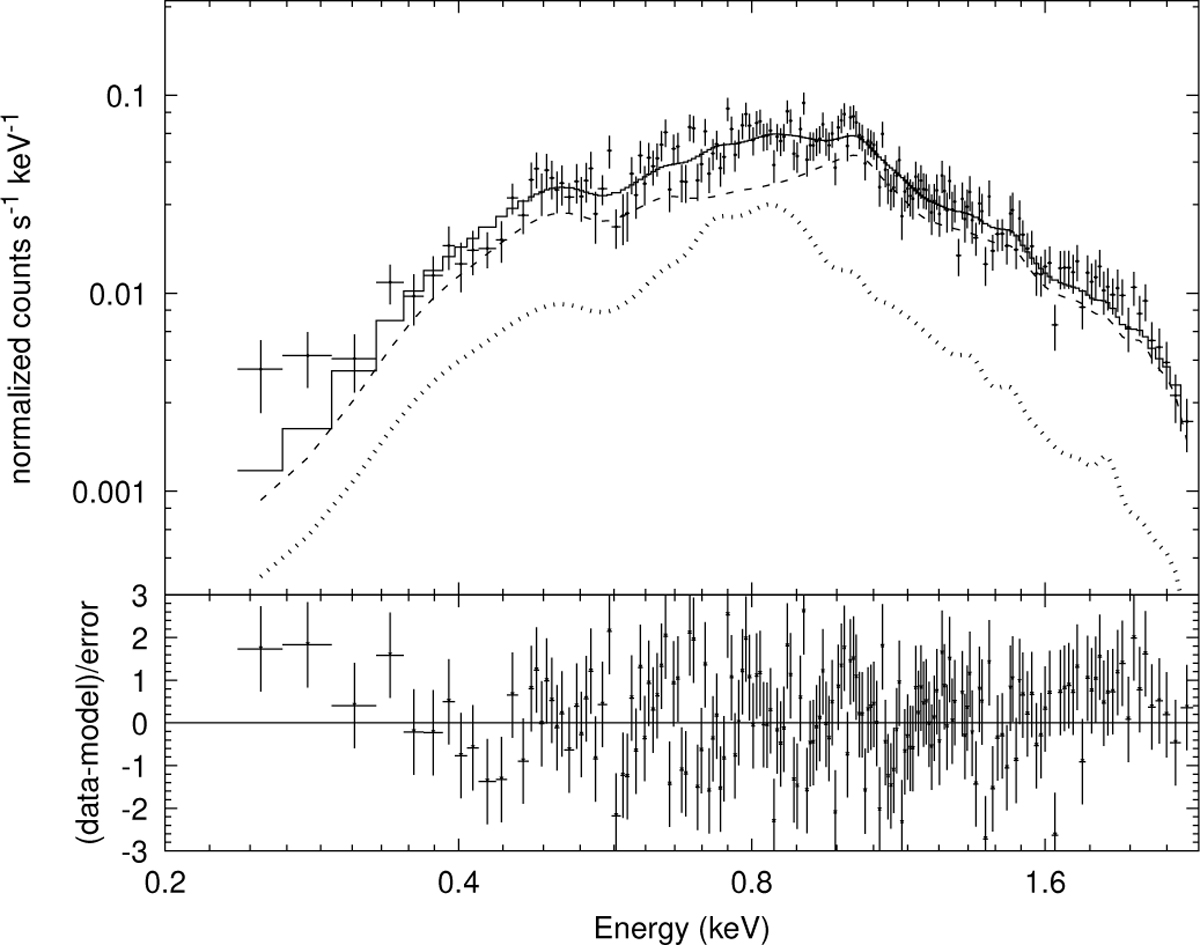
Example of an eROSITA X-ray spectrum, namely of the cluster member ID 5. The spectrum is fitted with a two-component APEC model (solid line) with respective temperatures of kBT1 = 0.68 keV (dotted line) and kBT2 = 1.24 keV (dashed line). The lower panel shows the normalised residuals.
Current usage metrics show cumulative count of Article Views (full-text article views including HTML views, PDF and ePub downloads, according to the available data) and Abstracts Views on Vision4Press platform.
Data correspond to usage on the plateform after 2015. The current usage metrics is available 48-96 hours after online publication and is updated daily on week days.
Initial download of the metrics may take a while.