Fig. 4
Download original image
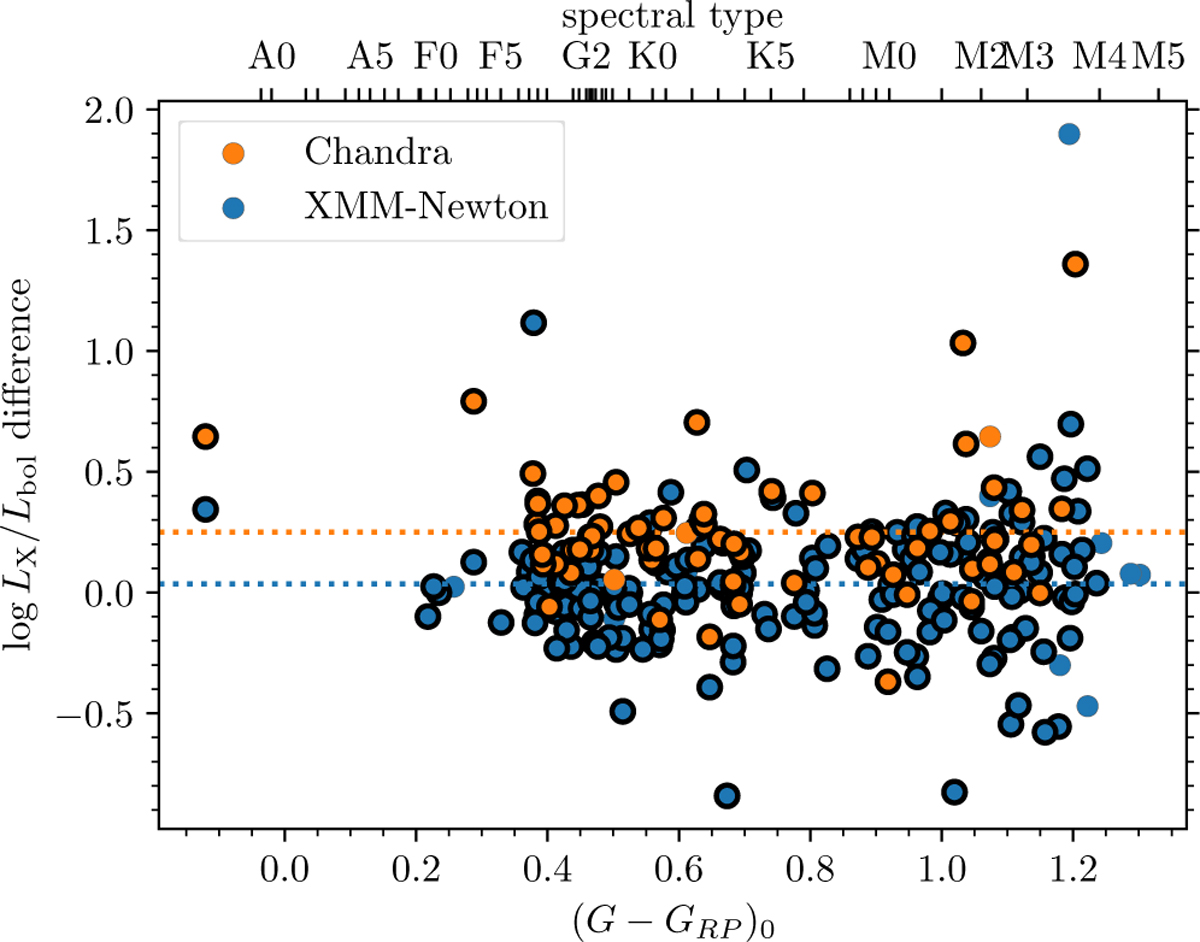
Differences in log LX/Lbol between eROSITA and Chandra (orange), and between eROSITA and XMM-Newton (blue). The differences are in the sense of (Other – eROSITA). The dotted lines show the mean offsets between the datasets. These offset values were used to adjust the prior data to the eROSITA level when necessary for cross-comparisons. Data points outlined in black indicate cluster members.
Current usage metrics show cumulative count of Article Views (full-text article views including HTML views, PDF and ePub downloads, according to the available data) and Abstracts Views on Vision4Press platform.
Data correspond to usage on the plateform after 2015. The current usage metrics is available 48-96 hours after online publication and is updated daily on week days.
Initial download of the metrics may take a while.