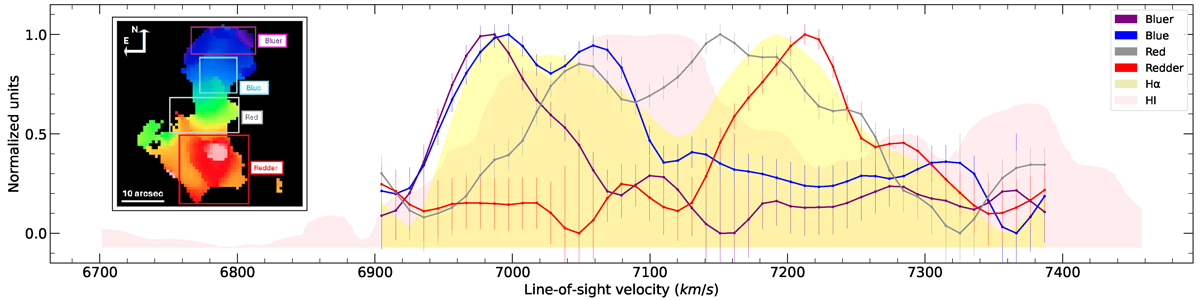
Fig. D.2.
Download original image
Velocity profiles integrated over different fields of view. The purple, blue, grey, and red profiles represent the Hα emission lines from the less redshifted northern regions to the more redshifted ones in the south, called bluer, blue, red, and redder, respectively. They are integrated into the rectangular boxes of the same colour shown in the inset on the left of the figure. This velocity field, is used here as a reference, and is the one already displayed on the left panel of Fig. 5. The profile in yellow represents the Hα line integrated over the entire object. Only profiles where a velocity could be calculated were used in the integrated profile. The profile in pink is the integrated HI from the ALFALFA survey profile. All profile amplitudes have been normalized to unity. Error bars are Poissonian.
Current usage metrics show cumulative count of Article Views (full-text article views including HTML views, PDF and ePub downloads, according to the available data) and Abstracts Views on Vision4Press platform.
Data correspond to usage on the plateform after 2015. The current usage metrics is available 48-96 hours after online publication and is updated daily on week days.
Initial download of the metrics may take a while.