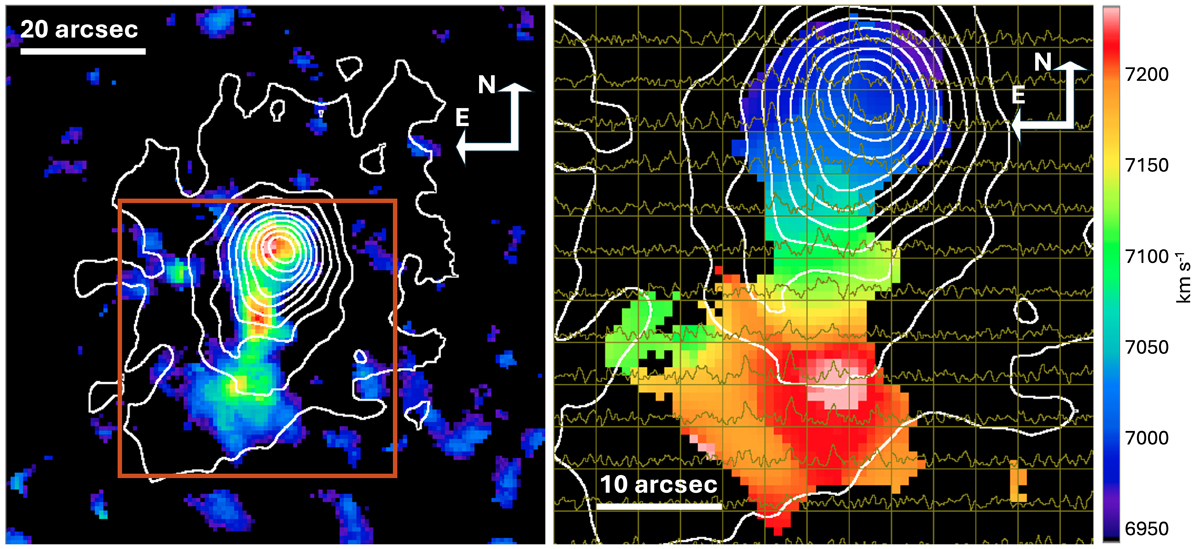
Fig. 5.
Download original image
Left: Hα emission line map of NGC 4098 and 4099, on which is superimposed the continuum emission below and beside the Hα line within a FWHM of 15 Å. The size of the total region shown is ∼1.45 × 1.45 arcmin2 (∼44.1 × 44.1 kpc2). Flux is in arbitrary units. Right: Hα line-of-sight velocity field zoomed by a factor of 2 from the brown square drawn on the left panel, on which are overplotted the same continuum isocontours. The size of the total region shown is ∼43.5 × 43.5 arcsec2 (∼22.1 × 22.1 kpc2). Each box containing each profile has dimensions of ∼3.4 × 3.4 arcsec2 (∼1.7 ×1.7 pc2), which correspond to a binning of 5 × 5 pixels; in other words, each box is the profile average of 25 spaxels. The x scale of each box spans over the free spectral range of the interferometer, ranging from ∼6896 to ∼7376 km s−1, the sampling step being 10.25 km s−1. The y scale is given in arbitrary units. These data have been observed with GHASP on the T193 at OHP.
Current usage metrics show cumulative count of Article Views (full-text article views including HTML views, PDF and ePub downloads, according to the available data) and Abstracts Views on Vision4Press platform.
Data correspond to usage on the plateform after 2015. The current usage metrics is available 48-96 hours after online publication and is updated daily on week days.
Initial download of the metrics may take a while.