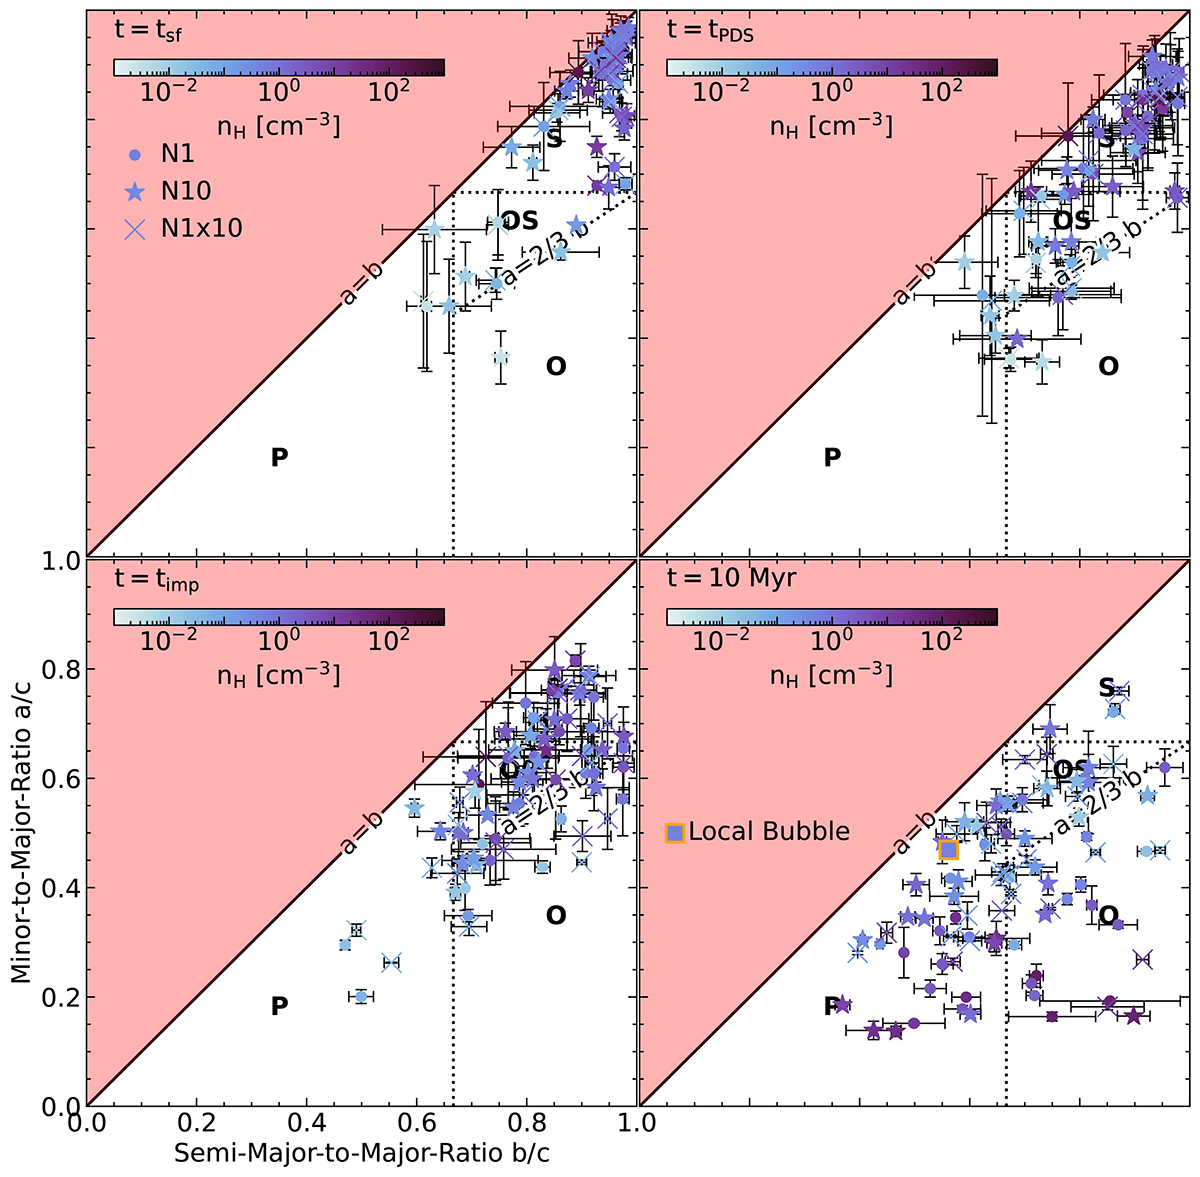
Fig. 11.
Download original image
Distribution of SNR shapes at various characteristic points in time for the different explosion models. Uncertainties due to the choice of Zej, thr are represented by error bars. Different regions are labeled as in Fig. 10. An orange and blue square depicts the shape of the LB derived from the 3D dust maps of Edenhofer et al. (2024) in the panel corresponding to t = 10 Myr. Error bars are smaller than the marker and thus not shown. At shell formation the SNRs tend to be spherical, with SNRs in lower-density environments being somewhat less spherical. At the end of the PDS stage and the onset of the implosion, most SNRs are still spherical or oblate spheroids with a/b ≳ 0.5 − 0.67. However, some of the lower-density SNRs are already quite asymmetric falling into the prolate and oblate category. The SNRs in the N10 model tend to be somewhat more spherical. At 10 Myr, the majority of SNRs are asymmetric. In dense environments, SNRs tend to be quite asymmetric, with low a/c ∼ 0.2. The model N1 tends to have lower a/b ∼ 0.5 compared to the other explosion models, which tend to have a/b ≳ 2/3.
Current usage metrics show cumulative count of Article Views (full-text article views including HTML views, PDF and ePub downloads, according to the available data) and Abstracts Views on Vision4Press platform.
Data correspond to usage on the plateform after 2015. The current usage metrics is available 48-96 hours after online publication and is updated daily on week days.
Initial download of the metrics may take a while.