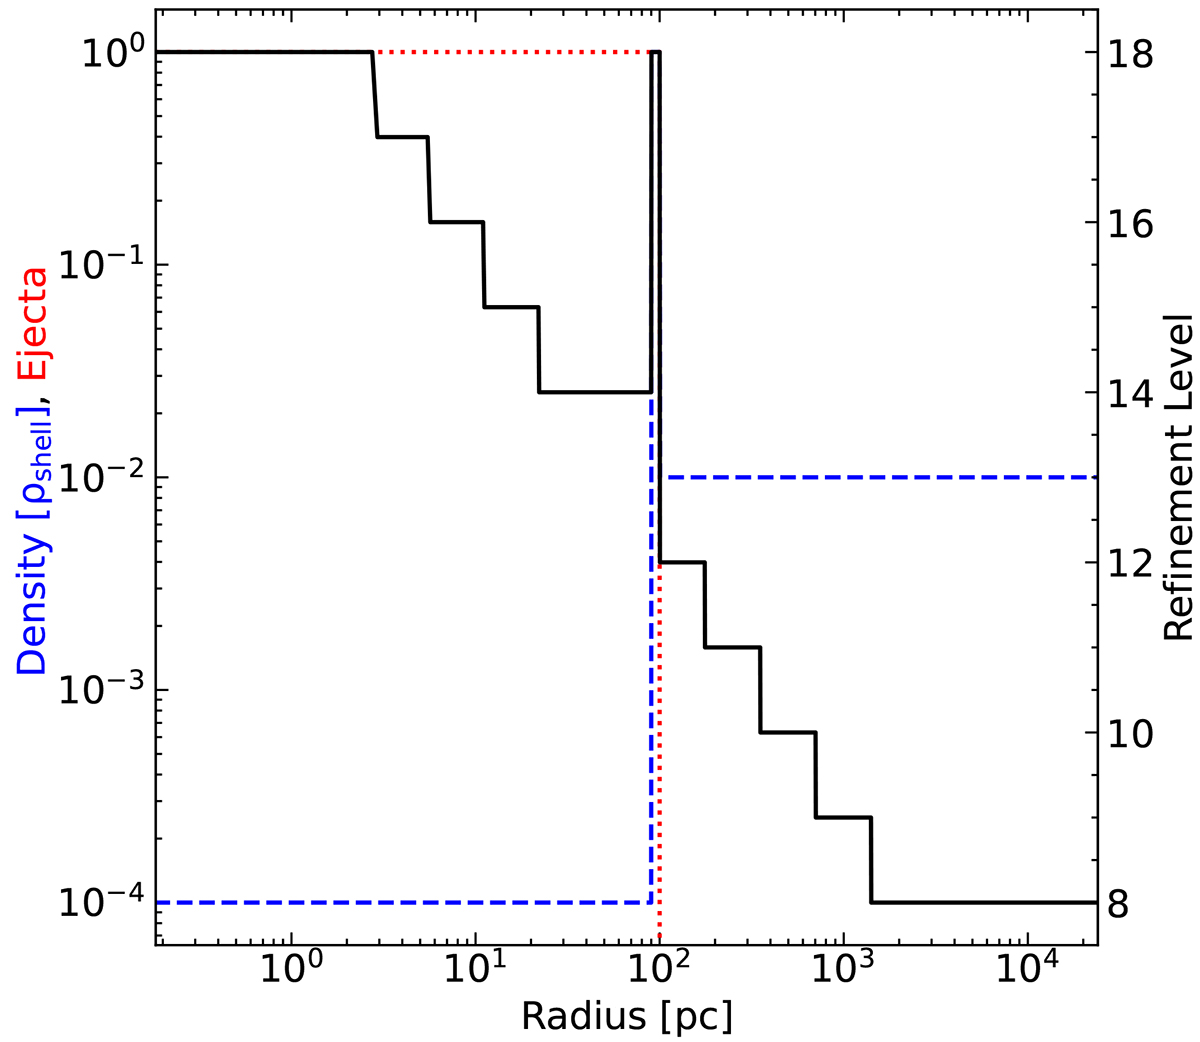
Fig. 3.
Download original image
Refinement map produced with the refinement method outlined in Sect. 2.2 for the idealized situation of a diffuse bubble with a dense shell, designed to roughly resemble an SNR after shell formation. The solid-black, dashed-blue and dotted-green lines show the radial profiles of the refinement level, gas density, and ejecta fraction (scalar tracer field), respectively. The resolution is decreasing radially outward, levels off at lmin, zoom = 14 and increasing again to lmax, zoom = 18 inside the shell.
Current usage metrics show cumulative count of Article Views (full-text article views including HTML views, PDF and ePub downloads, according to the available data) and Abstracts Views on Vision4Press platform.
Data correspond to usage on the plateform after 2015. The current usage metrics is available 48-96 hours after online publication and is updated daily on week days.
Initial download of the metrics may take a while.