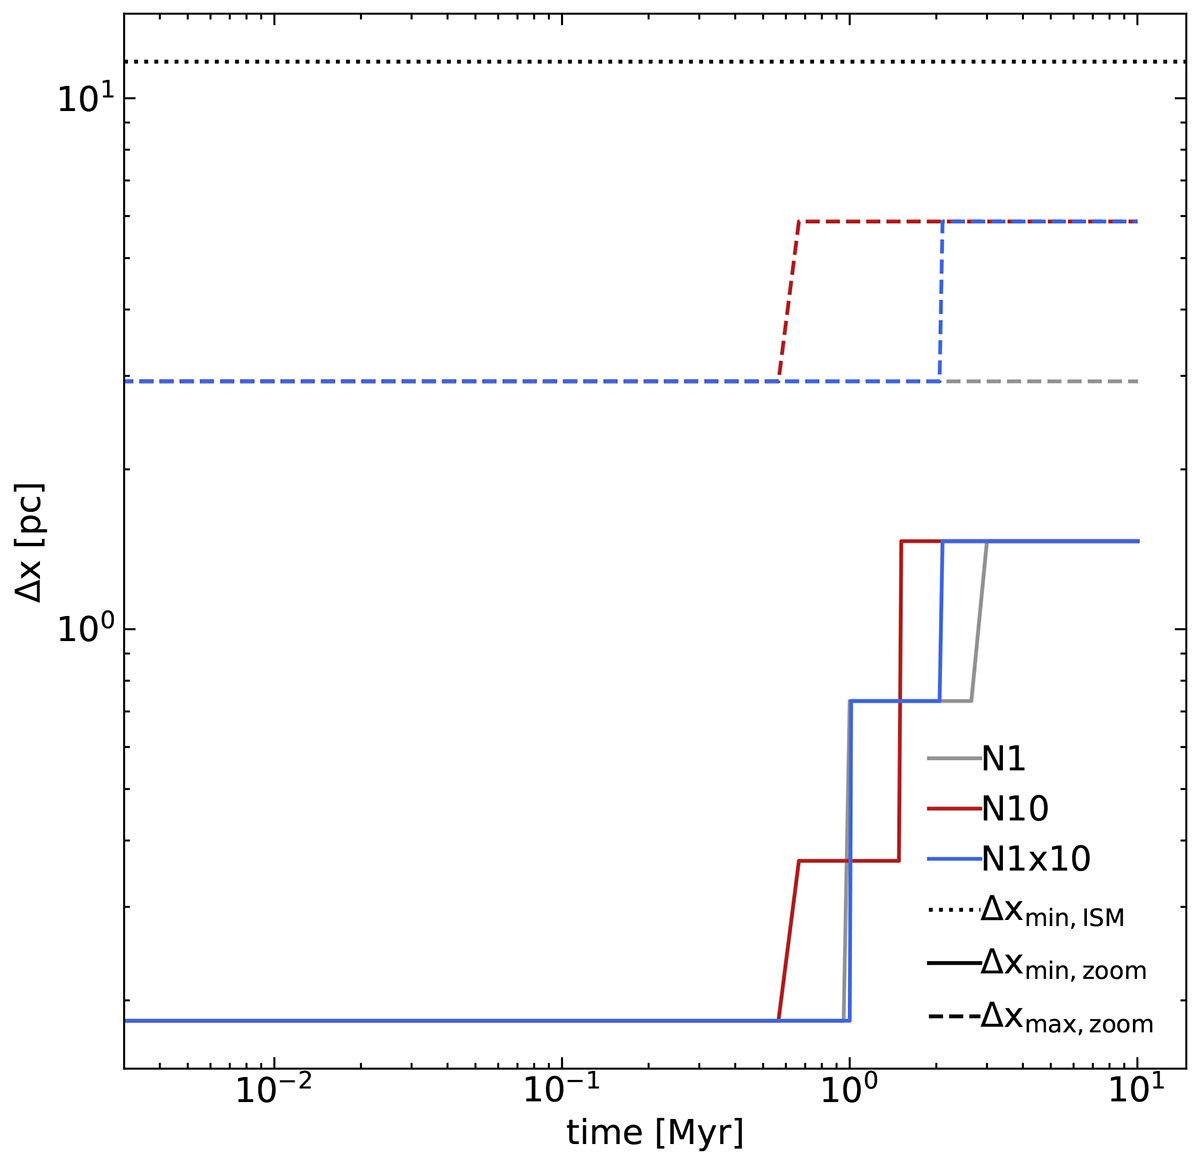
Fig. 4.
Download original image
Resolution in the zoom-in region as a function of time. Gray, red, and blue lines correspond to the three different runs, while different line styles correspond to different refinement parameters. The resolution was decreased between restarts of the simulation when the memory requirements became too large. The maximum resolution in the refinement regions around the central SNR particles was left untouched.
Current usage metrics show cumulative count of Article Views (full-text article views including HTML views, PDF and ePub downloads, according to the available data) and Abstracts Views on Vision4Press platform.
Data correspond to usage on the plateform after 2015. The current usage metrics is available 48-96 hours after online publication and is updated daily on week days.
Initial download of the metrics may take a while.