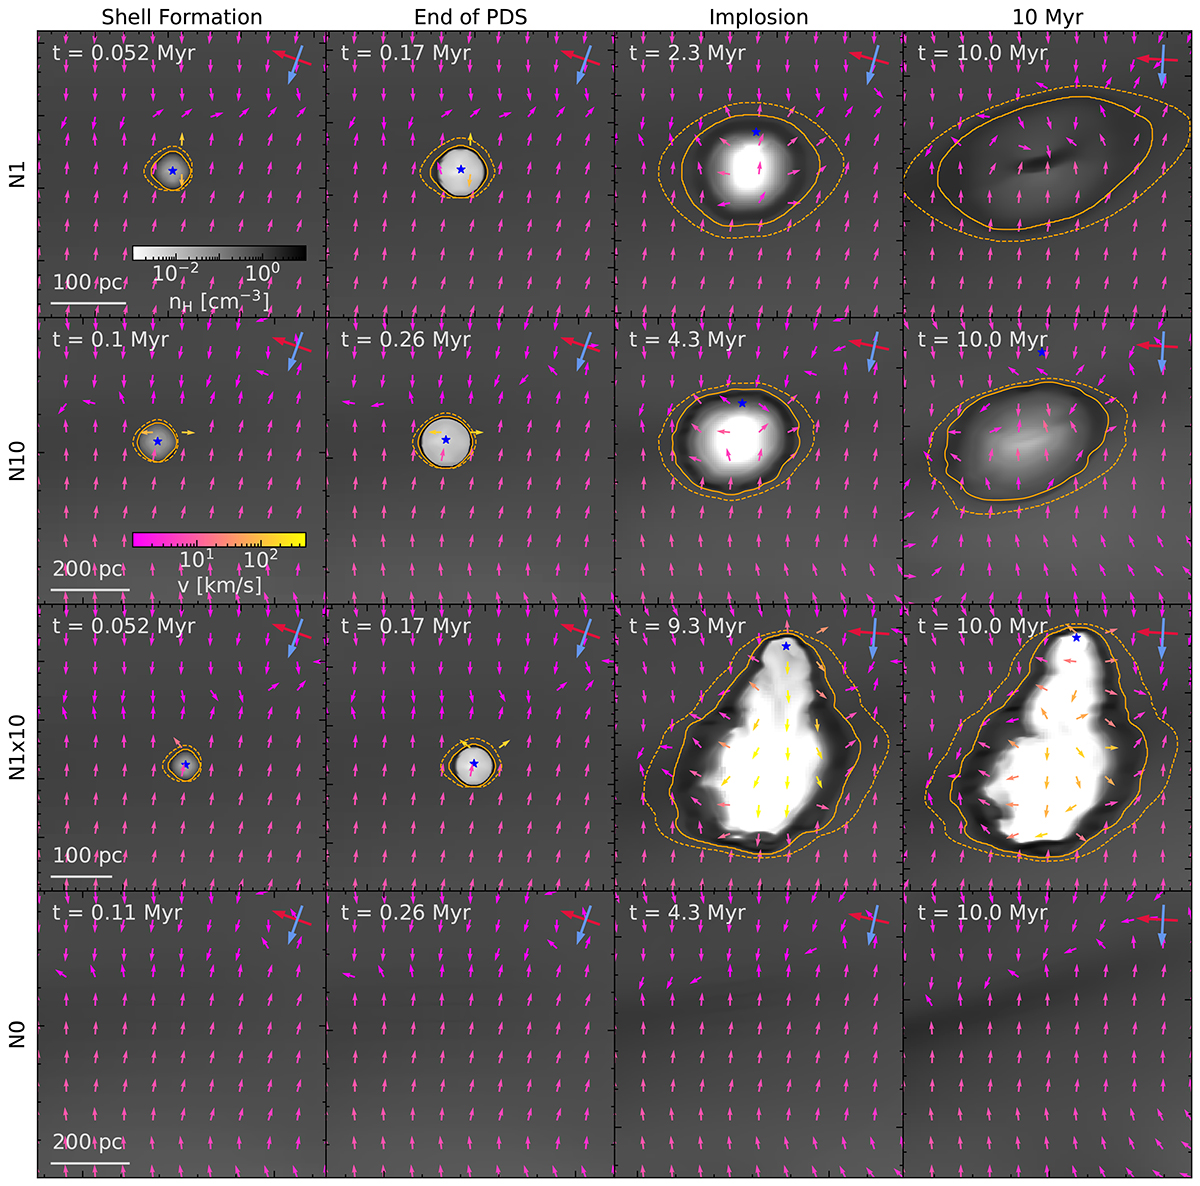
Fig. 5.
Download original image
Density slices through the central plane of the SNR #22 at various points in time for each model. Arrows are depicting the velocity field in the co-rotating center-of-mass frame of the local ISM. The various timescales correspond to different points in time for the different models. Red and blue arrows in the top-right corner of each panel indicate the directions of the galactic rotation and the galactic center, respectively. The dashed orange contour corresponds to the surface where Zej = Zthr, low, while the solid contour corresponds to Zej = Zthr, high. Since the various timescales are undefined for the model no_expl, we are using the same times as model N10. The SNe explode into a fairly homogeneous ISM, with a slowly collapsing, slight overdensity right where the SNe explode. At similar evolutionary stages the SNR is about twice as large in N10 compared to N1, with very similar geometry; Spheroidal with a slight elongation in the direction of rotation. On the other hand, the geometry in the model N1×10 qualitatively differs from the other models, with an elongated cavity normal to the rotational direction, due to the elliptical orbit (vR ∼ 20 km/s) of the explosion site. Only in the model N1, after 10 Myr a dense cloud, aligned with the SNR is forming in the center as predicted by Romano et al. (2024a).
Current usage metrics show cumulative count of Article Views (full-text article views including HTML views, PDF and ePub downloads, according to the available data) and Abstracts Views on Vision4Press platform.
Data correspond to usage on the plateform after 2015. The current usage metrics is available 48-96 hours after online publication and is updated daily on week days.
Initial download of the metrics may take a while.