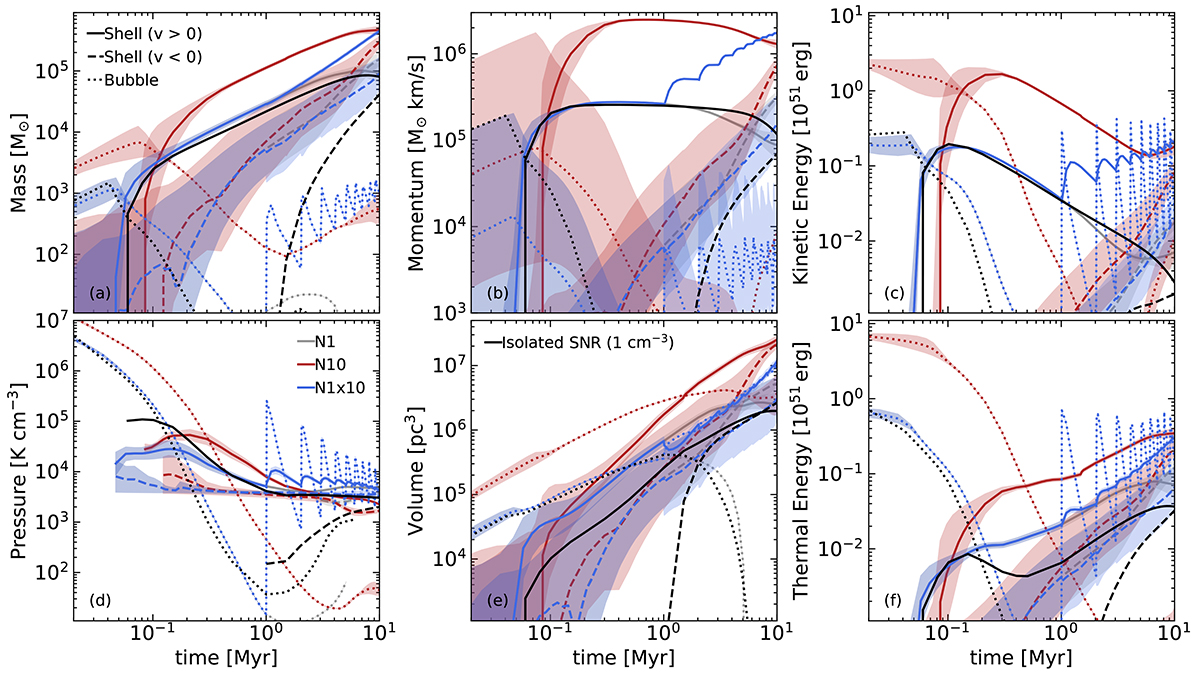
Fig. 6.
Download original image
Various properties (mass, momentum, kinetic and thermal energy, pressure, and volume) of the SNR #22 as a function of time for the various models using the classification introduced in Sect. 3.1. Shaded regions correspond to the margin of uncertainty introduced by the choice of Zej, thr, while the lines correspond to the geometric average of the values obtained with high and low values of Zej, thr. For comparison, we show the time evolution of an isolated SNR at a similar ambient density (nH = 1 cm−3) taken from Romano et al. (2024a). As expected, the models N1 and N10 exhibit similar behavior and the model N1 also agrees quantitatively well with the isolated SNR. In the model N1×10, the SNR initially follows the model N1 and then after the onset of the consecutive SNe diverges reaching a comparable mass, momentum and size as the model N10 after 10 Myr. However, the fraction of thermal energy in the bubble is higher in N1×10 compared to N10, indicating more efficient hot phase generation. The differences due to the choice of Zej, thr are largest before shell formation and are the most pronounced in the mass and momentum of the bubble, indicating that ejecta are initially lagging behind the shock, but catch up once a cold shell forms.
Current usage metrics show cumulative count of Article Views (full-text article views including HTML views, PDF and ePub downloads, according to the available data) and Abstracts Views on Vision4Press platform.
Data correspond to usage on the plateform after 2015. The current usage metrics is available 48-96 hours after online publication and is updated daily on week days.
Initial download of the metrics may take a while.