Fig. 8.
Download original image
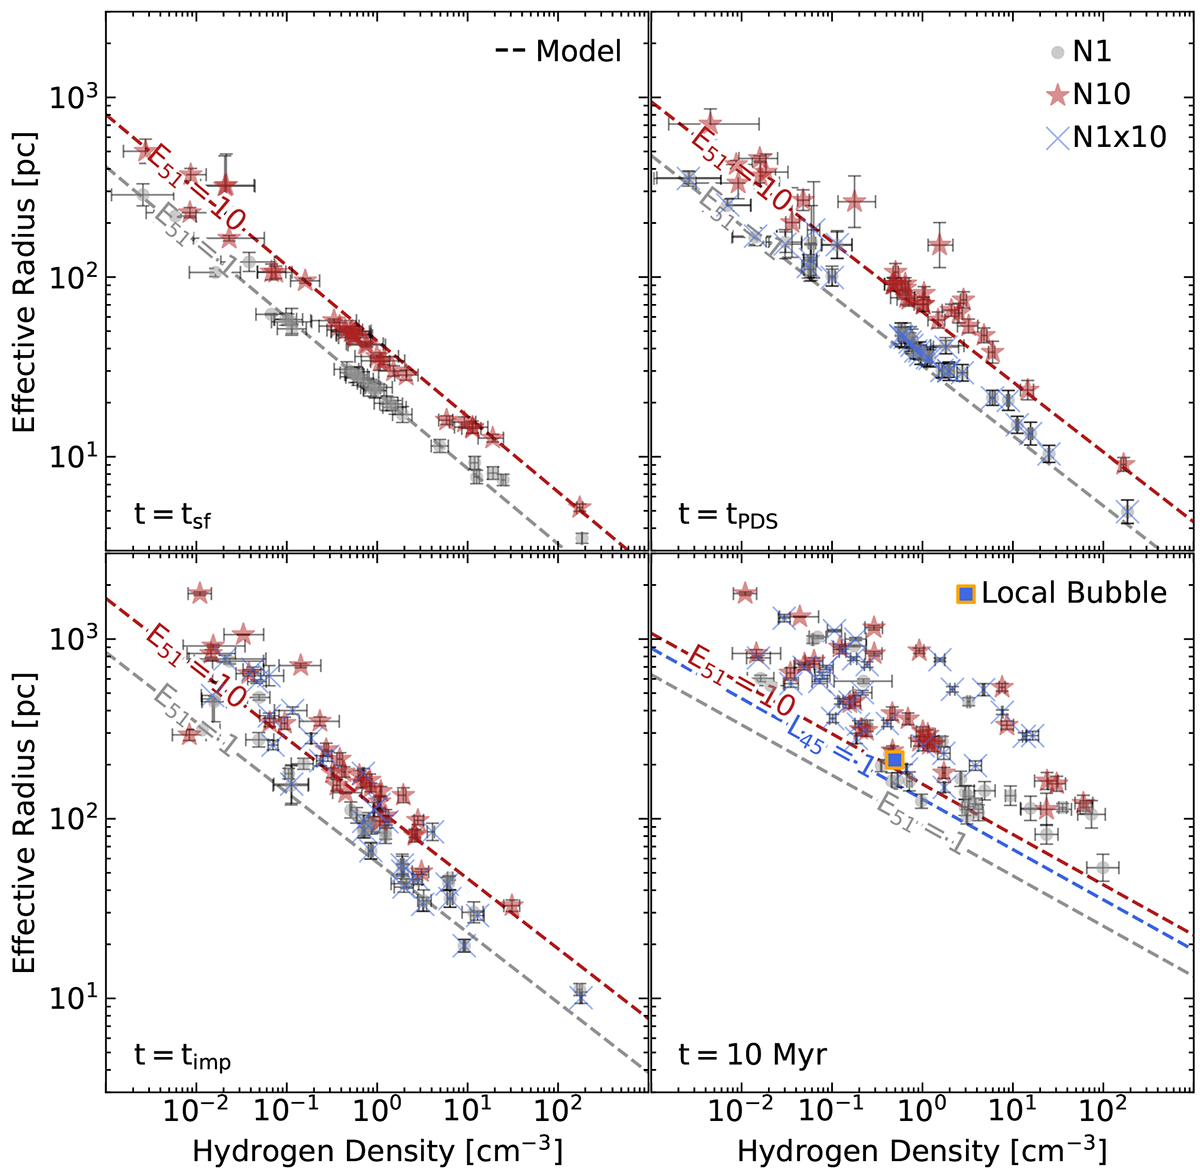
SNR size at various characteristic points in time as a function of ambient density for our simulated sample of SNRs. Uncertainties arise due to the finite spacing of the snapshots and due to the choice of Zej, thr. An orange and blue square depicts the effective radius of the LB derived from the 3D dust maps of Edenhofer et al. (2024) in the panel corresponding to t = 10 Myr. Error bars are smaller than the marker and thus not shown. The radii at shell formation, the end of the PDS phase and at SNR implosion agree well with the predictions from models based on simulations of isolated SNRs (Kim & Ostriker 2015; Romano et al. 2024a) for sufficiently large ambient densities. At low densities, the sizes tend to exceed the model predictions. After 10 Myr the SNRs are about twice the expected size.
Current usage metrics show cumulative count of Article Views (full-text article views including HTML views, PDF and ePub downloads, according to the available data) and Abstracts Views on Vision4Press platform.
Data correspond to usage on the plateform after 2015. The current usage metrics is available 48-96 hours after online publication and is updated daily on week days.
Initial download of the metrics may take a while.