Fig. 1.
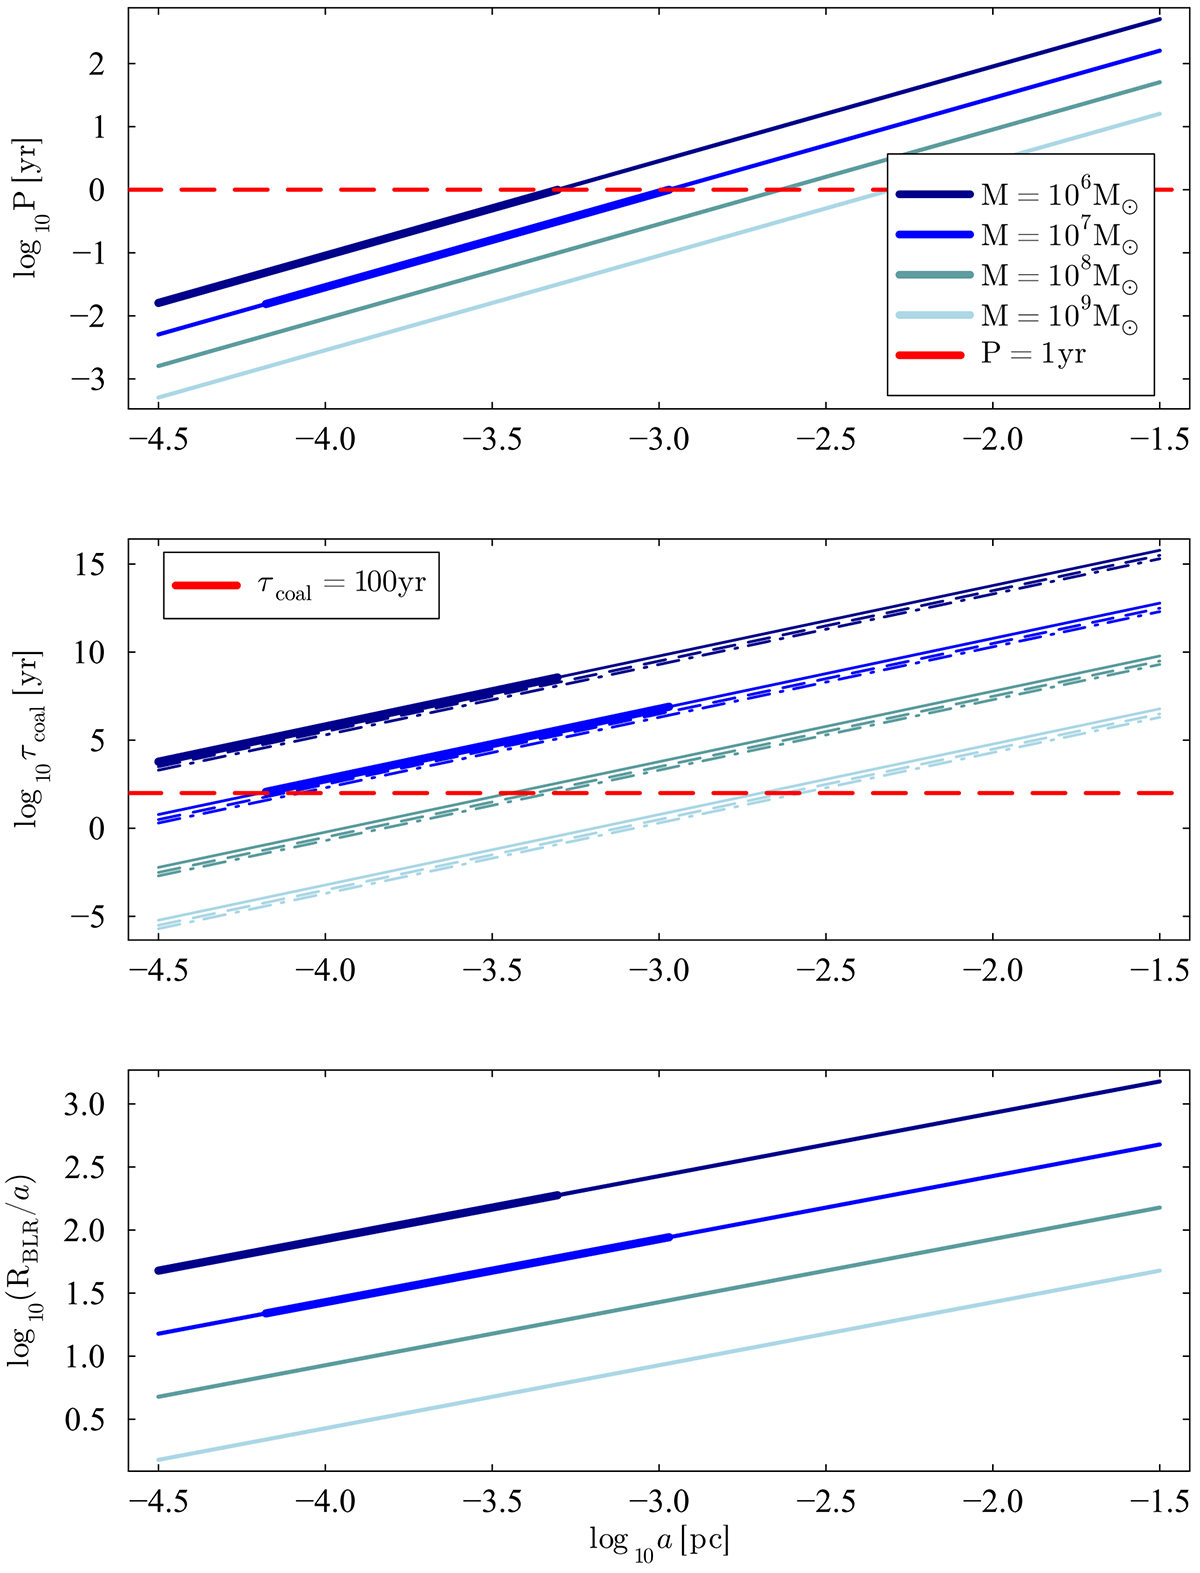
Download original image
Upper panel: Binary period for binaries with different total mass and separations. The horizontal dashed red line indicates where the period is P = 1 yr. Middle panel: Coalescence time of the binaries with different masses (see the colours in the upper panel) and mass ratios, q. The solid lines show binaries with q = 0.1, dashed lines show binaries with q = 0.25, and finally, dash-dotted lines show binaries with q = 1. The horizontal dashed red line indicates where the coalescence time due to GW emission is τcoal = 100 yr. Lower panel: Ratio between the characteristic radius of the BLR and the binary separation for different masses. In all three panels, the segments of the lines that meet the conditions of interest in this work (binaries with total masses of around 106 − 107 M⊙, an orbital period of P < 1 yr, and a coalescence time due to GW emission of τcoal > 100 yr) are drawn with a thicker line. In the middle panel, only the case of q = 0.1 has a thick segment to maintain readability.
Current usage metrics show cumulative count of Article Views (full-text article views including HTML views, PDF and ePub downloads, according to the available data) and Abstracts Views on Vision4Press platform.
Data correspond to usage on the plateform after 2015. The current usage metrics is available 48-96 hours after online publication and is updated daily on week days.
Initial download of the metrics may take a while.