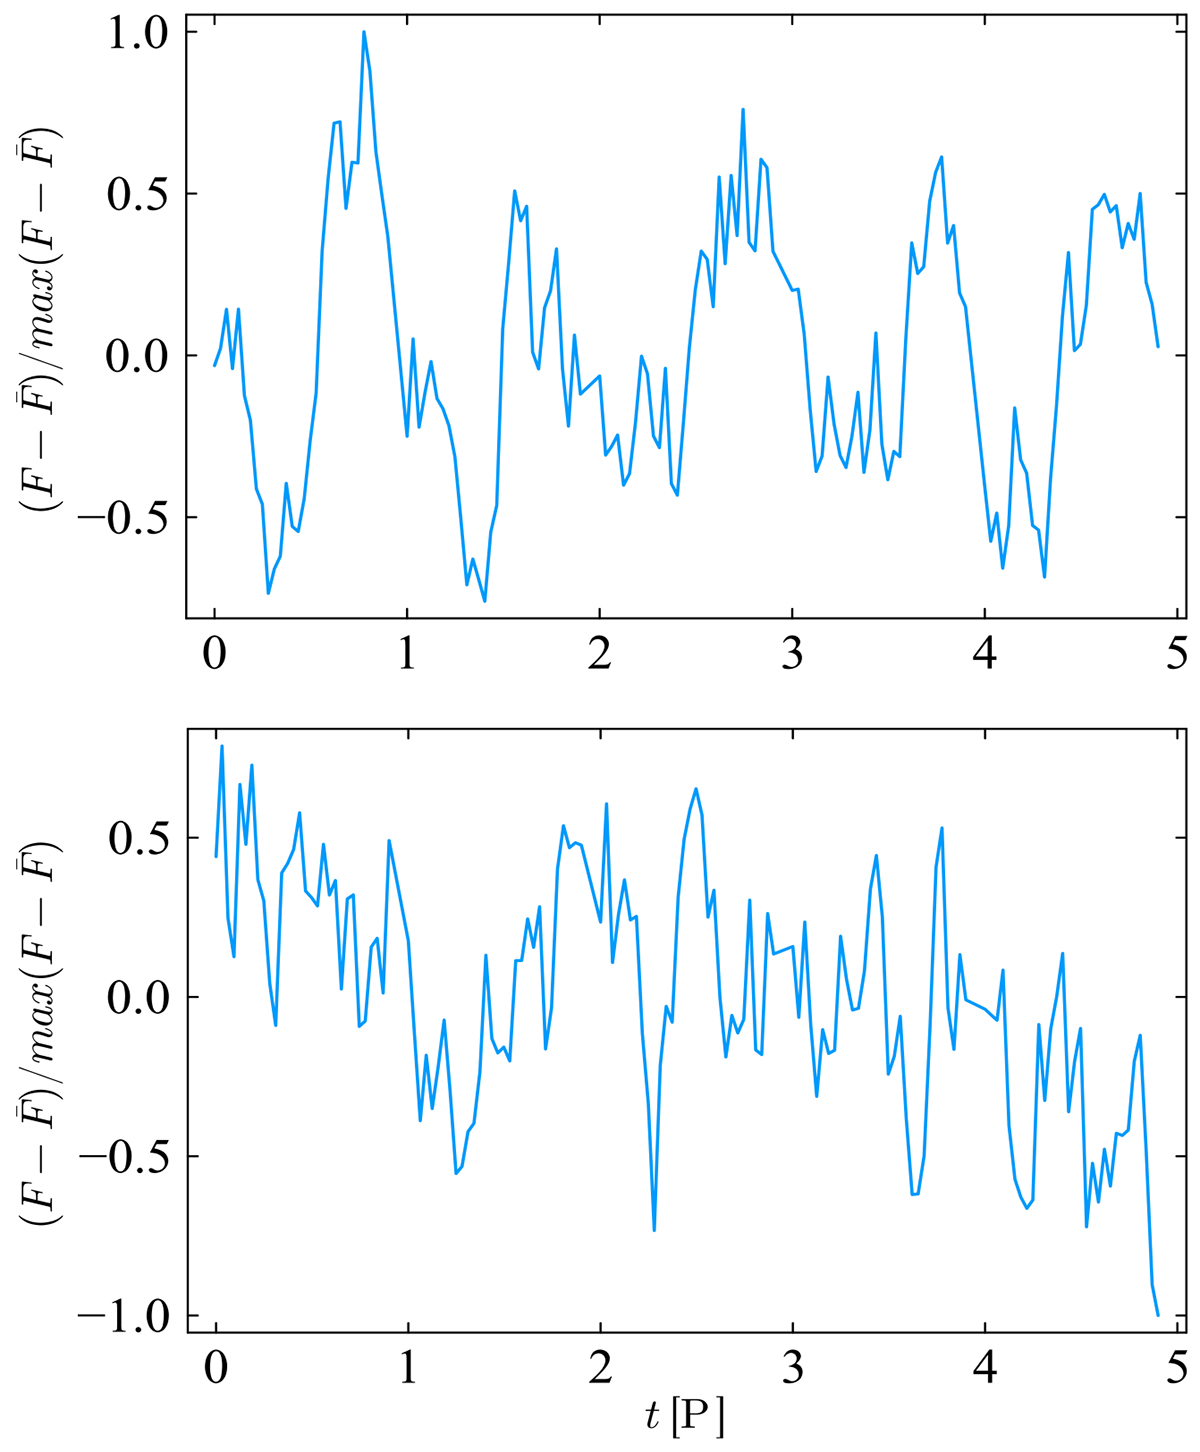
Fig. 10.
Download original image
Examples of light curves generated considering both the effects of the Doppler boost and of the variability induced by the damped random walk. In the lower panel, we show the case in which the S/N is 0.28, while in the upper panel, the S/N is 150, and the periodic variability induced by the Doppler boost can be clearly seen.
Current usage metrics show cumulative count of Article Views (full-text article views including HTML views, PDF and ePub downloads, according to the available data) and Abstracts Views on Vision4Press platform.
Data correspond to usage on the plateform after 2015. The current usage metrics is available 48-96 hours after online publication and is updated daily on week days.
Initial download of the metrics may take a while.