Open Access
Fig. B.3.
Download original image
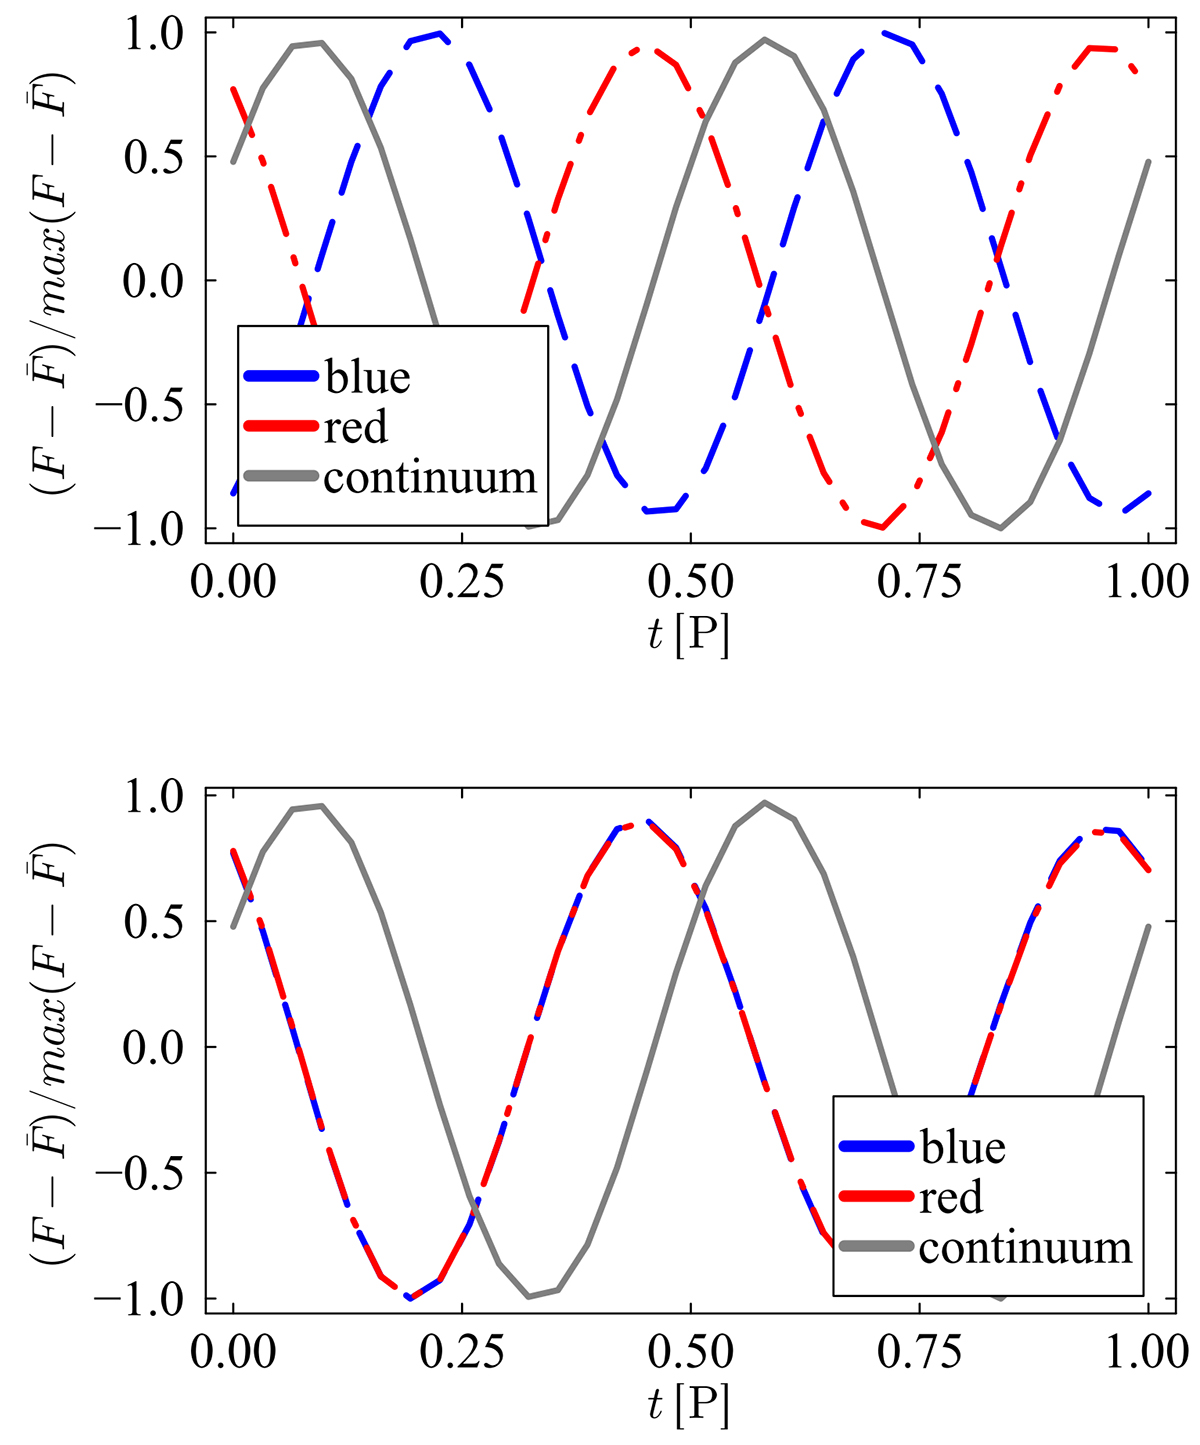
Example of how a cut in a different region of the BEL (those highlighted in figure B.2) can highlight the presence of a binary with the red and blue light curves separated by a half-period lag.
Current usage metrics show cumulative count of Article Views (full-text article views including HTML views, PDF and ePub downloads, according to the available data) and Abstracts Views on Vision4Press platform.
Data correspond to usage on the plateform after 2015. The current usage metrics is available 48-96 hours after online publication and is updated daily on week days.
Initial download of the metrics may take a while.