Fig. 6.
Download original image
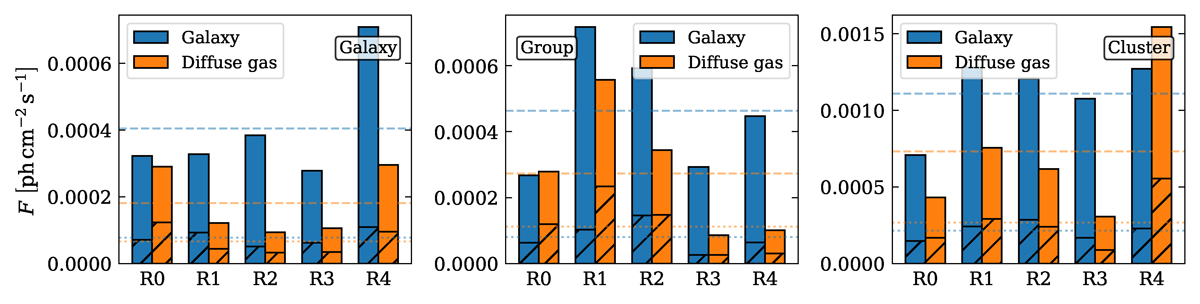
X-ray fluxes from line-of-sight galaxies (blue) and diffuse gas (orange) in different subregions. Panels from left to right correspond to the three cases: targeting a galaxy, a group, and a cluster (as given in Fig. 2), respectively. The shaded areas represent the fluxes between 0.4 keV and 0.85 keV. The dashed lines represent the mean values of the fluxes among five subregions in each case. The dotted lines represent the mean values in the shaded parts.
Current usage metrics show cumulative count of Article Views (full-text article views including HTML views, PDF and ePub downloads, according to the available data) and Abstracts Views on Vision4Press platform.
Data correspond to usage on the plateform after 2015. The current usage metrics is available 48-96 hours after online publication and is updated daily on week days.
Initial download of the metrics may take a while.