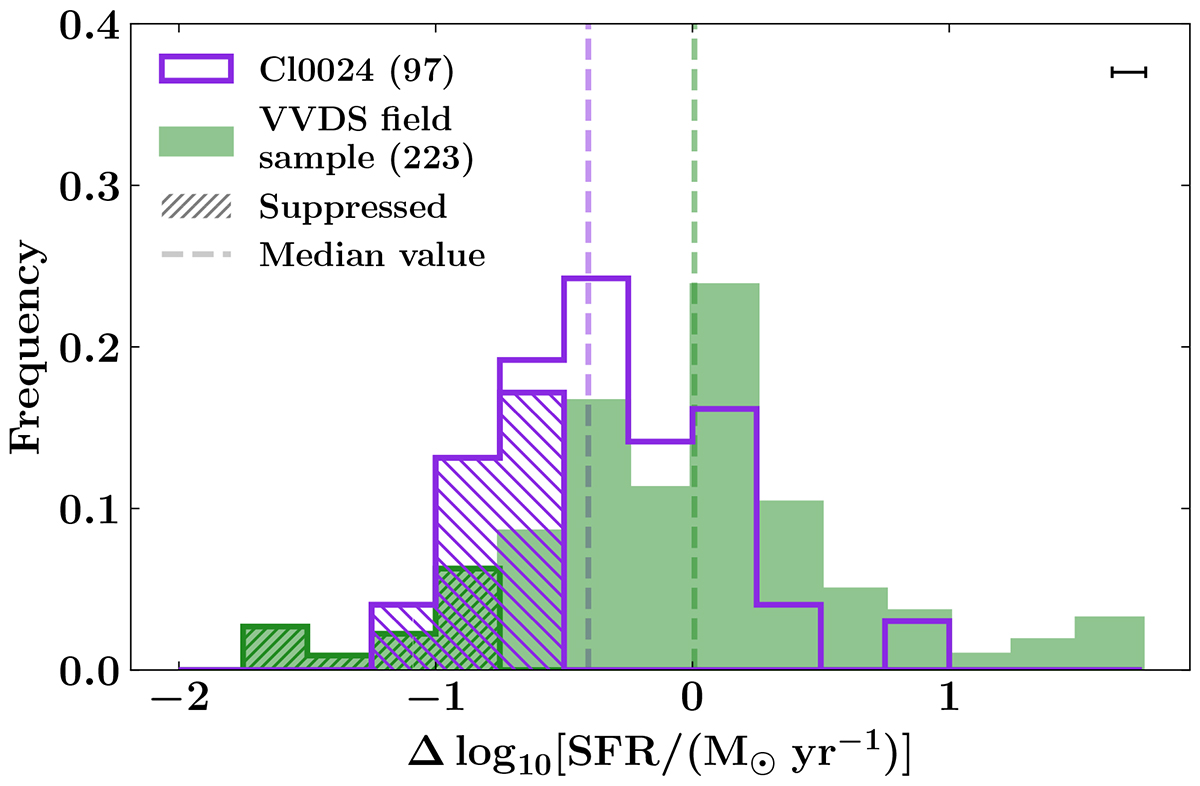
Fig. 11.
Download original image
Histograms of Δlog10(SFR) for Cl0024 and VVDS field galaxies. We plot the frequency of active and suppressed galaxies in each sample. The purple histogram is the distribution from Cl0024, while the green histogram is from the VVDS field galaxies. We also show the distribution of the suppressed galaxies with the hatched histograms of the same colour. In addition, we show the median of each distribution with the vertical dashed lines. Next to each sample legend, we show the total number of galaxies in parentheses. In the upper-right corner we show the median of the uncertainty bars of the SFRs.
Current usage metrics show cumulative count of Article Views (full-text article views including HTML views, PDF and ePub downloads, according to the available data) and Abstracts Views on Vision4Press platform.
Data correspond to usage on the plateform after 2015. The current usage metrics is available 48-96 hours after online publication and is updated daily on week days.
Initial download of the metrics may take a while.