Fig. 13.
Download original image
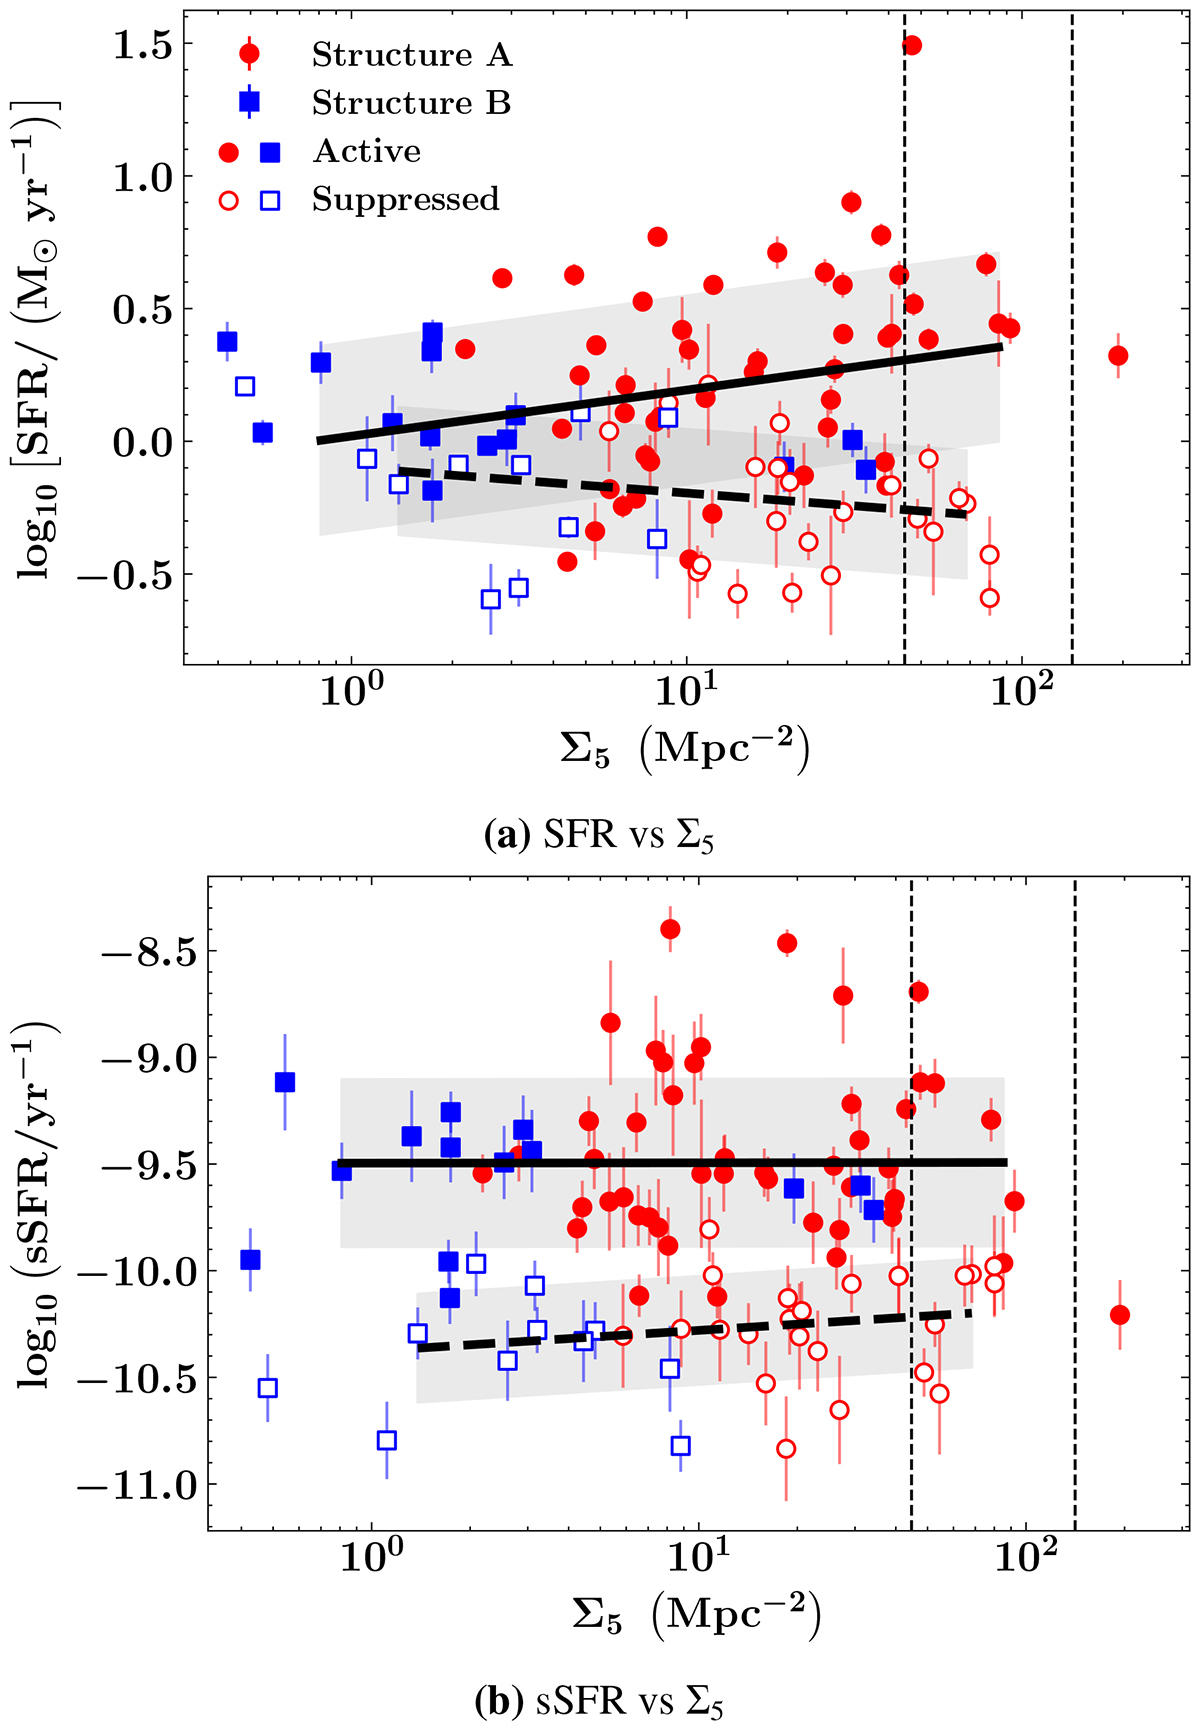
(Top) Star formation rate and (bottom) sSFR with respect to Σ5. We show the relation for structure A with red circles and for the structure B with blue squares. Filled symbols represent active SFRs while the emptied symbols are suppressed SFRs. Bins of Σ5 are indicated by the vertical dashed lines and show the separation in low, intermediate and high density subsamples. The black lines represent the fits to the running median of the SFRs/sSFRs of the galaxies of both structures, calculated in bins of 5 points, and the grey-filled area represent the 1σ deviation of the SFR and sSFRs. The solid line is for the active galaxies and the dashed one for the suppressed galaxies.
Current usage metrics show cumulative count of Article Views (full-text article views including HTML views, PDF and ePub downloads, according to the available data) and Abstracts Views on Vision4Press platform.
Data correspond to usage on the plateform after 2015. The current usage metrics is available 48-96 hours after online publication and is updated daily on week days.
Initial download of the metrics may take a while.