Open Access
Fig. 14.
Download original image
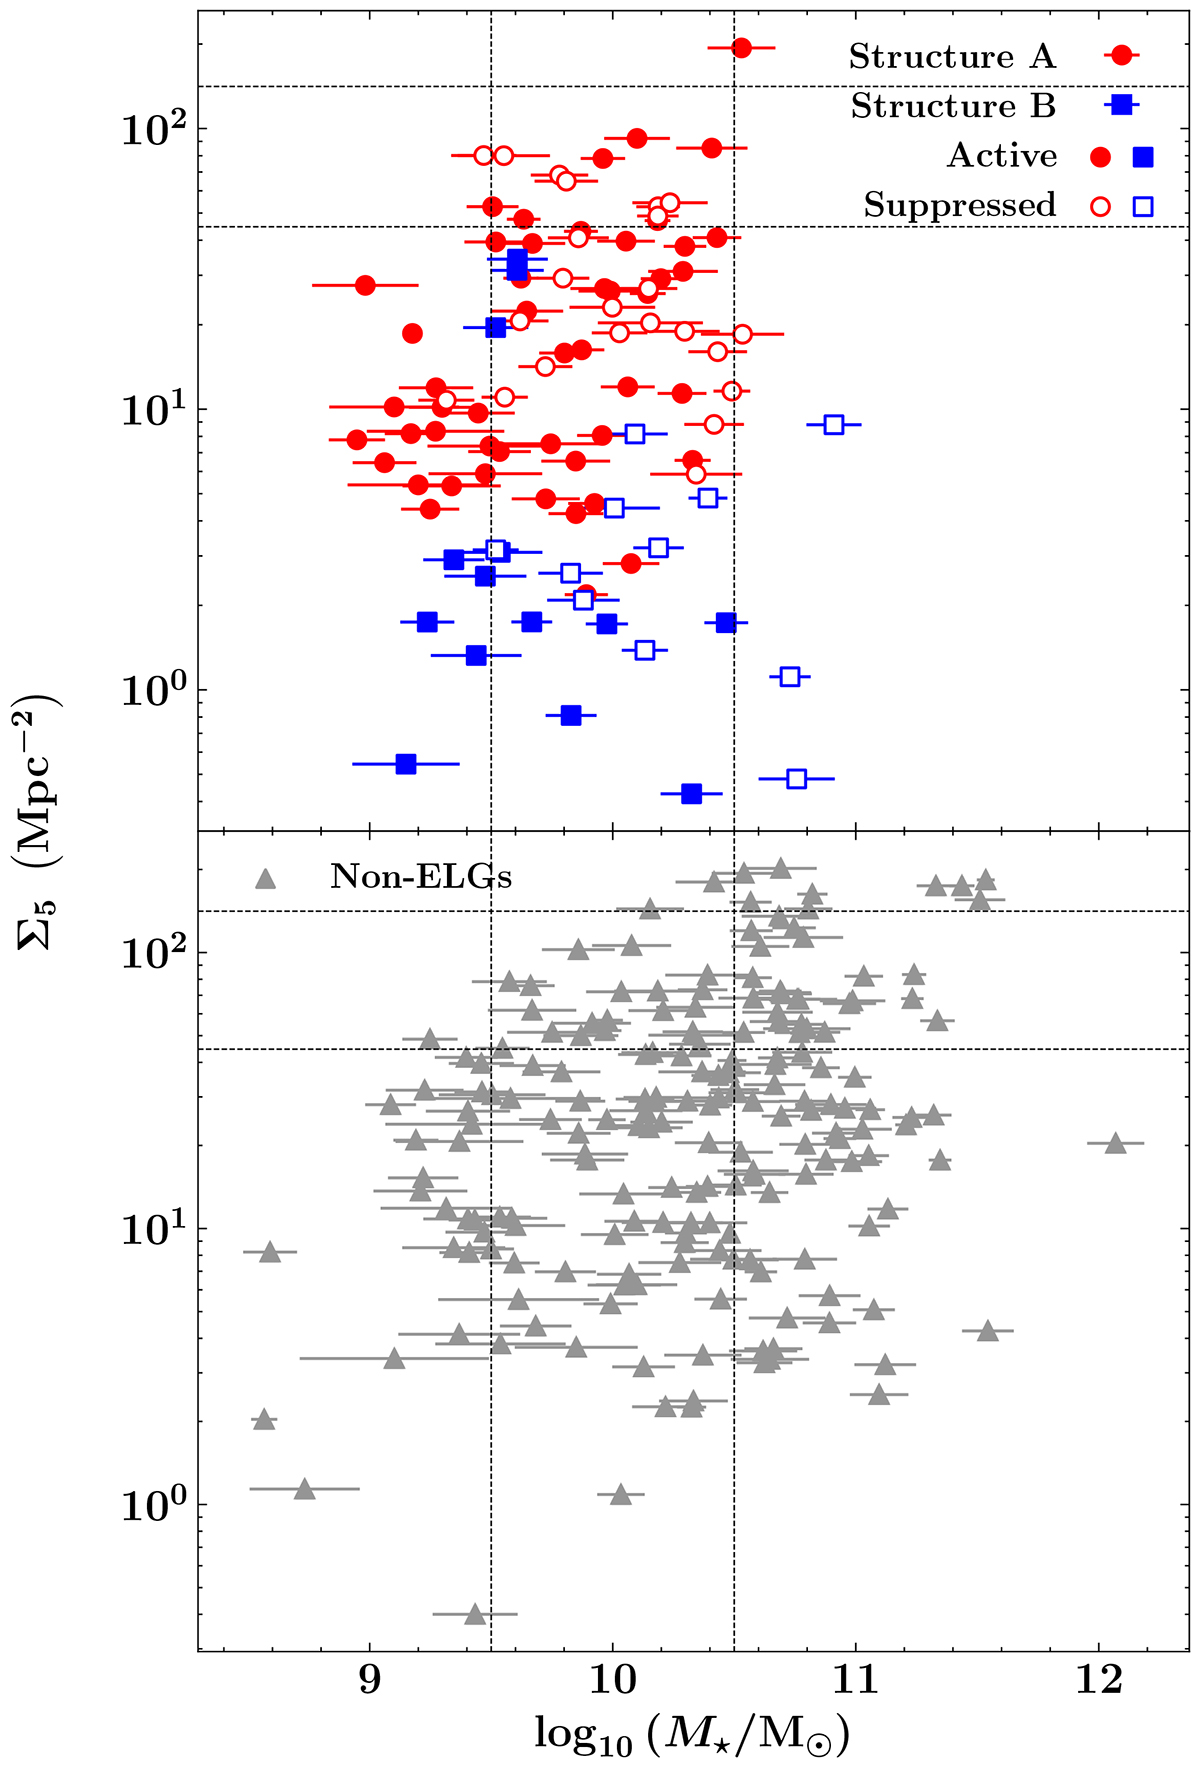
Relation of Σ5 − M⋆ for (upper panel) active, suppressed, and (lower panel) non-emitter galaxies. Symbols in the upper panel are the same as in Fig. 13. Bins of Σ5 and M⋆ are indicated by the horizontal and vertical dashed lines, respectively, and show the separation in low, intermediate and high density or mass subsamples.
Current usage metrics show cumulative count of Article Views (full-text article views including HTML views, PDF and ePub downloads, according to the available data) and Abstracts Views on Vision4Press platform.
Data correspond to usage on the plateform after 2015. The current usage metrics is available 48-96 hours after online publication and is updated daily on week days.
Initial download of the metrics may take a while.