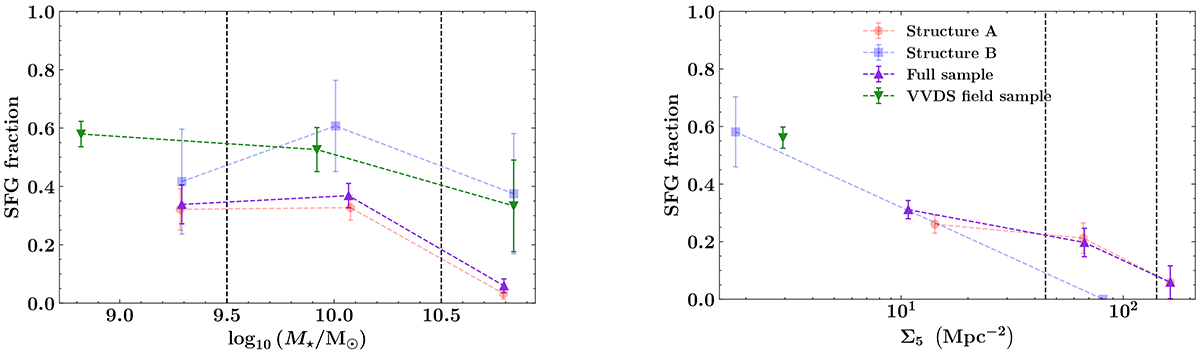
Fig. 15.
Download original image
Fractions of SFGs with respect to (left) M⋆ and (right) Σ5. Bins are indicated by the vertical dashed lines and show the separation in low, intermediate, and high mass or density subsamples. We show fractions from structure A with red circles, from structure B with blue squares and from the full cluster sample (sum of structures A and B) with purple triangles; the fractions from the VVDS field sample are depicted by the green inverted triangles. For M⋆, a total of 359 sources were employed, while for Σ5 a total of 361 sources were employed. Error bars represent the Poisson statistics errors associated with the fractions in their specific bin.
Current usage metrics show cumulative count of Article Views (full-text article views including HTML views, PDF and ePub downloads, according to the available data) and Abstracts Views on Vision4Press platform.
Data correspond to usage on the plateform after 2015. The current usage metrics is available 48-96 hours after online publication and is updated daily on week days.
Initial download of the metrics may take a while.