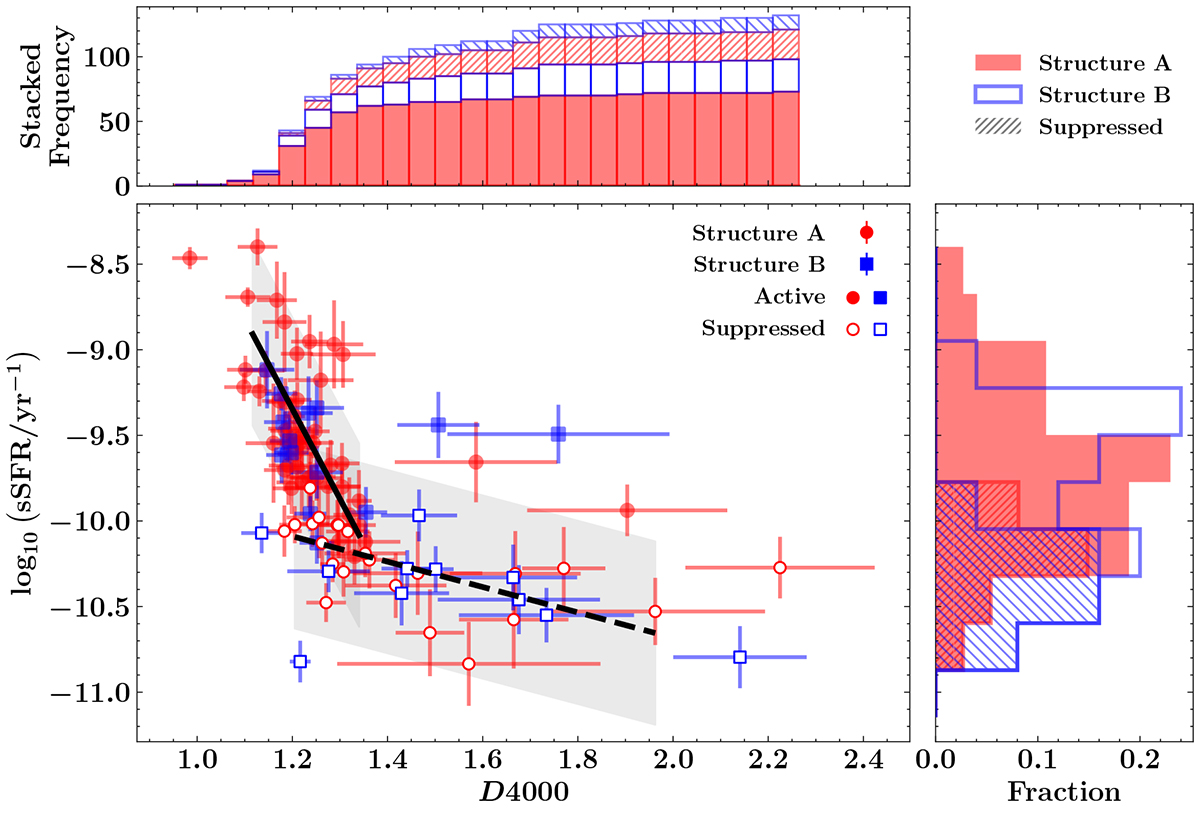
Fig. 16.
Download original image
Relation of log10(sSFR)−D4000. Symbols are the same as in Fig. 13. The black lines represent the fits to the running median of the sSFRs of the galaxies of both structures A and B, calculated in bins of 5 points, and the grey-filled areas represent the 1σ deviation of the sSFRs. For active sSFRs (solid line), we sorted the points vertically, and horizontally for the suppressed sSFRs (dashed line). Upper and right histograms show the distributions of D4000 (stacked cumulative histogram) and log10(sSFR), respectively, for active and suppressed populations, divided in structures A and B.
Current usage metrics show cumulative count of Article Views (full-text article views including HTML views, PDF and ePub downloads, according to the available data) and Abstracts Views on Vision4Press platform.
Data correspond to usage on the plateform after 2015. The current usage metrics is available 48-96 hours after online publication and is updated daily on week days.
Initial download of the metrics may take a while.