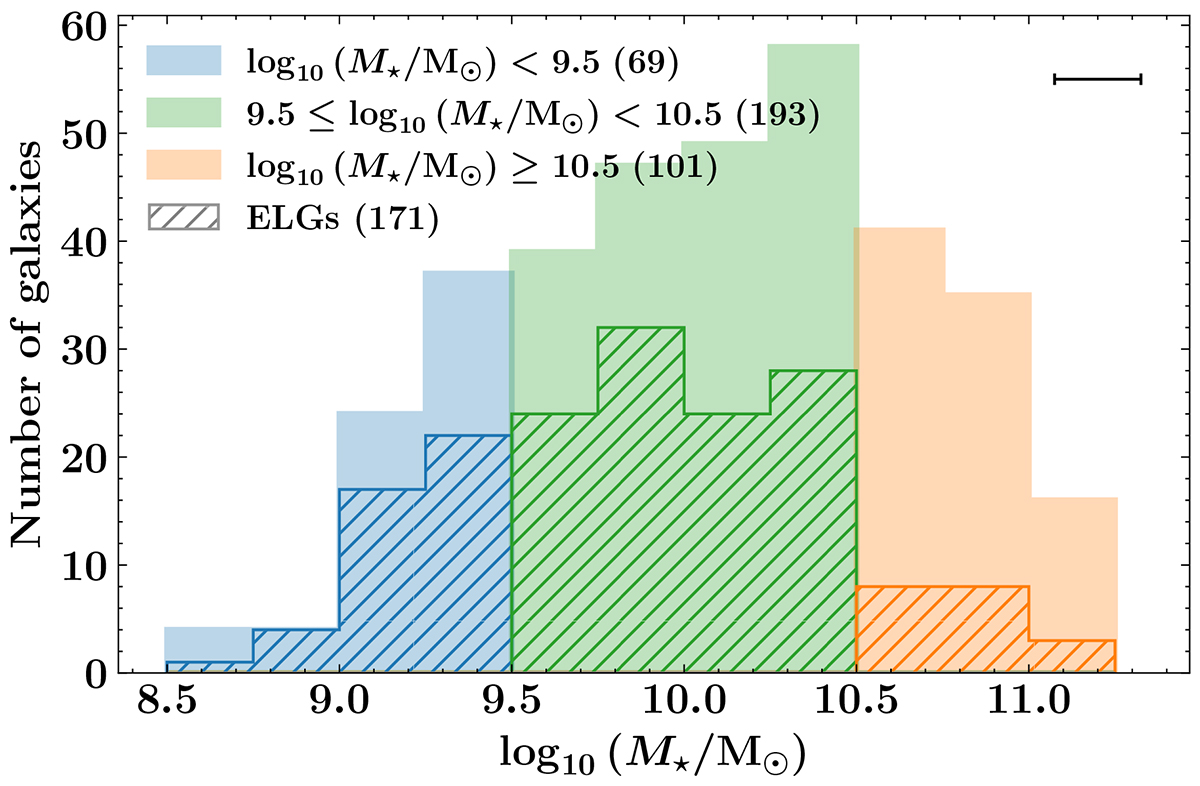
Fig. 2.
Download original image
Distribution of M⋆ computed using CIGALE for 363 galaxies of the cluster (171 ELGs and 192 non-ELGs). The distribution is divided into three segments: low-mass (in blue), intermediate-mass (in green), and high-mass galaxies (in orange). We show the distribution of ELGs with the hatched histograms. In the legend, between parentheses, we include the number of galaxies within each subsample, and in the upper-right corner we show the median of the uncertainty bars of M⋆.
Current usage metrics show cumulative count of Article Views (full-text article views including HTML views, PDF and ePub downloads, according to the available data) and Abstracts Views on Vision4Press platform.
Data correspond to usage on the plateform after 2015. The current usage metrics is available 48-96 hours after online publication and is updated daily on week days.
Initial download of the metrics may take a while.